## Line Chart: mAP@10 vs. Representation Size
### Overview
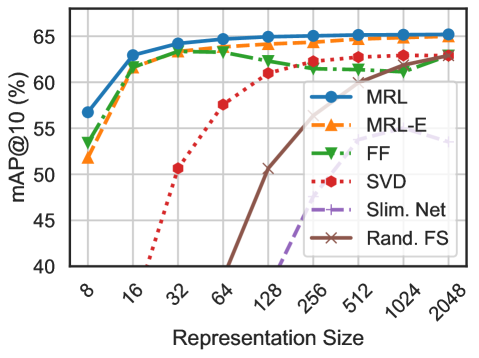
The image is a line chart comparing the performance of different methods (MRL, MRL-E, FF, SVD, Slim. Net, and Rand. FS) based on their mean Average Precision at 10 (mAP@10) as the representation size increases. The x-axis represents the representation size, and the y-axis represents the mAP@10 in percentage.
### Components/Axes
* **Title:** There is no explicit title on the chart.
* **X-axis:** Representation Size. The x-axis is labeled "Representation Size" and has the following tick marks: 8, 16, 32, 64, 128, 256, 512, 1024, 2048.
* **Y-axis:** mAP@10 (%). The y-axis is labeled "mAP@10 (%)" and has tick marks at 40, 45, 50, 55, 60, and 65.
* **Legend:** Located on the right side of the chart.
* **MRL:** Solid blue line with circle markers.
* **MRL-E:** Dashed orange line with triangle markers.
* **FF:** Dashed green line with inverted triangle markers.
* **SVD:** Dotted red line with circle markers.
* **Slim. Net:** Dashed-dotted purple line with plus markers.
* **Rand. FS:** Solid brown line with cross markers.
### Detailed Analysis
* **MRL (Solid Blue Line):**
* Trend: Increases sharply from 8 to 16, then plateaus.
* Data Points:
* 8: ~57%
* 16: ~63%
* 32: ~64%
* 64: ~65%
* 128: ~65%
* 256: ~65%
* 512: ~65%
* 1024: ~65%
* 2048: ~64%
* **MRL-E (Dashed Orange Line):**
* Trend: Increases sharply from 8 to 32, then plateaus with a slight decrease at the end.
* Data Points:
* 8: ~52%
* 16: ~62%
* 32: ~64%
* 64: ~64%
* 128: ~63%
* 256: ~64%
* 512: ~64%
* 1024: ~63%
* 2048: ~63%
* **FF (Dashed Green Line):**
* Trend: Increases sharply from 8 to 32, then plateaus with a slight decrease at the end.
* Data Points:
* 8: ~54%
* 16: ~62%
* 32: ~64%
* 64: ~64%
* 128: ~63%
* 256: ~62%
* 512: ~62%
* 1024: ~61%
* 2048: ~63%
* **SVD (Dotted Red Line):**
* Trend: Increases steadily from 8 to 1024.
* Data Points:
* 8: ~40%
* 16: ~40%
* 32: ~50%
* 64: ~58%
* 128: ~62%
* 256: ~63%
* 512: ~64%
* 1024: ~63%
* 2048: ~64%
* **Slim. Net (Dashed-Dotted Purple Line):**
* Trend: Increases from 8 to 2048.
* Data Points:
* 8: ~40%
* 16: ~40%
* 32: ~40%
* 64: ~40%
* 128: ~40%
* 256: ~42%
* 512: ~50%
* 1024: ~54%
* 2048: ~55%
* **Rand. FS (Solid Brown Line):**
* Trend: Increases from 8 to 2048.
* Data Points:
* 8: ~40%
* 16: ~40%
* 32: ~40%
* 64: ~40%
* 128: ~50%
* 256: ~53%
* 512: ~58%
* 1024: ~61%
* 2048: ~64%
### Key Observations
* MRL, MRL-E, and FF achieve high mAP@10 with smaller representation sizes and plateau quickly.
* SVD, Slim. Net, and Rand. FS require larger representation sizes to achieve comparable performance.
* MRL consistently performs well across all representation sizes.
* Slim. Net and Rand. FS start with very low mAP@10 values and gradually improve with increasing representation size.
### Interpretation
The chart illustrates the trade-off between representation size and performance (mAP@10) for different methods. MRL, MRL-E, and FF are more efficient in terms of representation size, achieving high performance with smaller representations. SVD, Slim. Net, and Rand. FS require larger representation sizes to reach similar performance levels. This suggests that MRL, MRL-E, and FF may be more suitable for applications where representation size is a constraint. The performance of Slim. Net and Rand. FS is significantly lower at smaller representation sizes, indicating that they may require more data or more complex models to achieve good performance.