## Line Chart: mAP@10 vs. Representation Size
### Overview
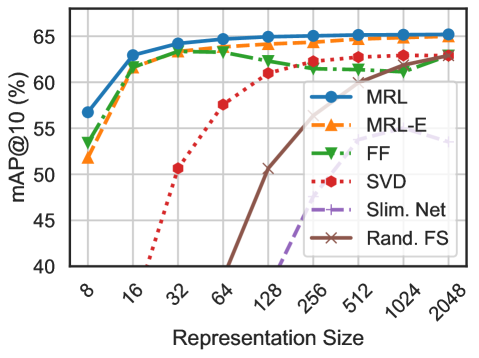
This image presents a line chart illustrating the relationship between "Representation Size" and "mAP@10" (mean Average Precision at 10) for six different methods: MRL, MRL-E, FF, SVD, Slim. Net, and Rand. FS. The chart displays how the performance metric (mAP@10) changes as the representation size increases.
### Components/Axes
* **X-axis:** "Representation Size" with values ranging from 8 to 2048. The scale is logarithmic, with markers at 8, 16, 32, 64, 128, 256, 512, 1024, and 2048.
* **Y-axis:** "mAP@10 (%)" with values ranging from 40% to 65%. The scale is linear, with gridlines at 5% intervals.
* **Legend:** Located in the top-right corner, identifying each line with a color and label:
* MRL (Blue)
* MRL-E (Orange)
* FF (Green)
* SVD (Red)
* Slim. Net (Purple)
* Rand. FS (Brown)
### Detailed Analysis
Here's a breakdown of each line's trend and approximate data points, verified against the legend colors:
* **MRL (Blue):** The line starts at approximately 52% at a representation size of 8, rises sharply to around 64% at a representation size of 16, plateaus around 65% between representation sizes of 32 and 2048.
* **MRL-E (Orange):** The line begins at approximately 50% at a representation size of 8, increases to around 63% at a representation size of 16, and then plateaus around 64-65% from a representation size of 64 to 2048.
* **FF (Green):** The line starts at approximately 55% at a representation size of 8, increases to around 62% at a representation size of 16, and then plateaus around 62-63% from a representation size of 32 to 2048.
* **SVD (Red):** The line exhibits a decreasing trend initially, starting at approximately 51% at a representation size of 8, dropping to around 49% at a representation size of 16, and then increasing sharply to around 62% at a representation size of 1024 and 63% at 2048.
* **Slim. Net (Purple):** The line starts at approximately 42% at a representation size of 8, and increases sharply to around 60% at a representation size of 128, and then plateaus around 60-61% from a representation size of 256 to 2048.
* **Rand. FS (Brown):** The line starts at approximately 40% at a representation size of 8, and increases steadily to around 62% at a representation size of 2048.
### Key Observations
* MRL and MRL-E consistently achieve the highest mAP@10 values across all representation sizes, with performance plateauing at higher sizes.
* SVD initially performs poorly but shows a significant improvement at larger representation sizes.
* Slim. Net shows a delayed but steady improvement, reaching a plateau at a lower mAP@10 than MRL and MRL-E.
* Rand. FS exhibits a consistent, but slower, improvement in mAP@10 as representation size increases.
* The performance of most methods plateaus as the representation size increases beyond 64, suggesting diminishing returns.
### Interpretation
The chart demonstrates the impact of representation size on the performance of different methods for a given task (likely information retrieval or similar). The consistent high performance of MRL and MRL-E suggests they are effective at capturing relevant information even with smaller representations. The initial poor performance of SVD, followed by improvement at larger sizes, indicates that it requires a substantial amount of data to effectively represent the information. The plateauing effect observed across most methods suggests that there is a limit to the benefits of increasing representation size beyond a certain point. This could be due to factors such as overfitting or the inherent limitations of the data itself. The differences in performance between the methods highlight the importance of choosing an appropriate representation strategy for a given task and dataset. The chart provides valuable insights into the trade-offs between representation size, computational cost, and performance.