## Line Chart: Performance (mAP@10) vs. Representation Size for Various Methods
### Overview
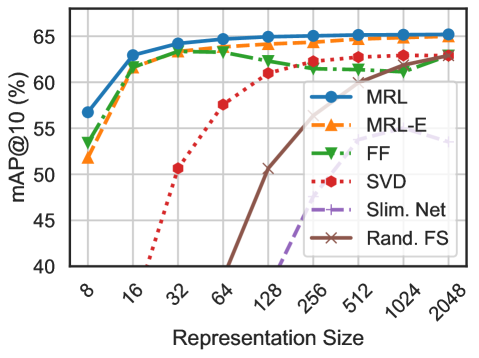
The image is a line chart comparing the performance of six different methods (MRL, MRL-E, FF, SVD, Slim. Net, Rand. FS) as a function of their representation size. Performance is measured by mAP@10 (mean Average Precision at 10, a common information retrieval metric) expressed as a percentage. The chart demonstrates how each method's accuracy scales with increasing model or representation complexity.
### Components/Axes
* **Chart Type:** Multi-series line chart with markers.
* **Y-Axis:**
* **Label:** `mAP@10 (%)`
* **Scale:** Linear, ranging from 40 to 65.
* **Major Ticks:** 40, 45, 50, 55, 60, 65.
* **X-Axis:**
* **Label:** `Representation Size`
* **Scale:** Logarithmic (base 2), with values doubling at each major tick.
* **Major Ticks (Values):** 8, 16, 32, 64, 128, 256, 512, 1024, 2048.
* **Legend:**
* **Position:** Top-right corner, inside the plot area.
* **Entries (from top to bottom as listed):**
1. **MRL:** Solid blue line with circle markers.
2. **MRL-E:** Dashed orange line with upward-pointing triangle markers.
3. **FF:** Dash-dot green line with downward-pointing triangle markers.
4. **SVD:** Dotted red line with circle markers.
5. **Slim. Net:** Dashed purple line with plus (+) markers.
6. **Rand. FS:** Solid brown line with 'x' markers.
### Detailed Analysis
**Trend Verification & Data Point Extraction (Approximate Values):**
1. **MRL (Blue, Circle):**
* **Trend:** Starts highest, increases rapidly, then plateaus near the top.
* **Points:** (8, ~57), (16, ~63), (32, ~64), (64, ~65), (128, ~65), (256, ~65), (512, ~65), (1024, ~65), (2048, ~65).
2. **MRL-E (Orange, Up-Triangle):**
* **Trend:** Follows a very similar trajectory to MRL but is consistently slightly lower.
* **Points:** (8, ~52), (16, ~62), (32, ~63), (64, ~64), (128, ~64), (256, ~64), (512, ~64), (1024, ~64), (2048, ~64).
3. **FF (Green, Down-Triangle):**
* **Trend:** Increases to a peak around size 64, then shows a slight decline before stabilizing.
* **Points:** (8, ~54), (16, ~62), (32, ~63), (64, ~64), (128, ~63), (256, ~62), (512, ~62), (1024, ~62), (2048, ~63).
4. **SVD (Red, Circle, Dotted):**
* **Trend:** Starts very low, exhibits a steep, nearly linear increase on this log-scale x-axis, and converges toward the top group at large sizes.
* **Points:** (8, <40), (16, ~40), (32, ~51), (64, ~58), (128, ~61), (256, ~62), (512, ~63), (1024, ~63), (2048, ~63).
5. **Slim. Net (Purple, Plus, Dashed):**
* **Trend:** Begins off the chart (below 40), emerges at size 128, and increases steadily but remains in the lower performance tier.
* **Points:** (128, ~40), (256, ~50), (512, ~54), (1024, ~55), (2048, ~56).
6. **Rand. FS (Brown, 'x', Solid):**
* **Trend:** The lowest-performing method. Starts off-chart, emerges at size 64, and increases slowly.
* **Points:** (64, ~40), (128, ~50), (256, ~55), (512, ~58), (1024, ~60), (2048, ~62).
### Key Observations
1. **Performance Saturation:** MRL, MRL-E, and FF reach near-peak performance at relatively small representation sizes (32-64) and show minimal gains beyond that. This suggests diminishing returns for these methods beyond a certain complexity.
2. **Convergence at Scale:** At the largest representation size (2048), the performance gap between most methods narrows significantly, with five of the six methods clustering between ~62% and ~65% mAP@10.
3. **Distinct Scaling Behaviors:** The methods fall into three clear groups based on their scaling curves:
* **High & Early Plateau:** MRL, MRL-E, FF.
* **Steep, Late Riser:** SVD.
* **Lower Tier, Steady Growth:** Slim. Net, Rand. FS.
4. **Outlier:** Rand. FS, likely representing a random feature selection baseline, is consistently the worst performer until the very largest sizes, where it begins to catch up.
### Interpretation
This chart is a classic model scaling analysis, likely from a machine learning or computer vision paper. It answers the question: "How does increasing the dimensionality or capacity of a representation affect retrieval or classification accuracy for different techniques?"
* **What the data suggests:** The methods MRL and MRL-E are highly efficient, achieving top-tier performance with very compact representations. This makes them preferable for applications where memory or computational cost is a constraint. The SVD method requires significantly larger representations to become competitive, suggesting it is less efficient at encoding discriminative information into small dimensions. The random baseline (Rand. FS) confirms that the learned representations are indeed valuable, as even a poor learned method (Slim. Net) outperforms random selection for most of the range.
* **Relationship between elements:** The x-axis (cost/complexity) is directly traded against the y-axis (benefit/accuracy). The chart visualizes the Pareto frontier of this trade-off for each method. The plateauing of the top methods indicates they have reached the inherent limit of the dataset's discriminative information for this task.
* **Notable Anomaly:** The slight dip in the FF (green) line after size 64 is interesting. It could indicate mild overfitting as the model becomes more complex, or it could be a statistical fluctuation in the experiment. This would warrant further investigation in the original research context.