## Line Graph: mAP@10% Performance vs. Representation Size
### Overview
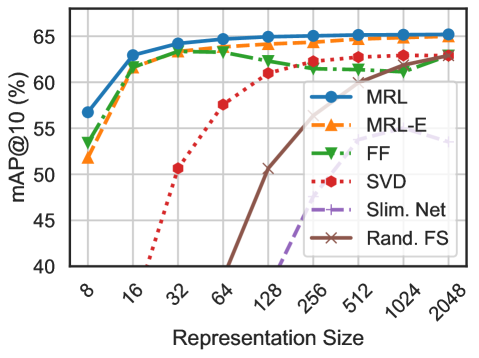
The graph compares the mean Average Precision at 10% (mAP@10%) performance of six different methods across varying representation sizes (8 to 2048). The y-axis ranges from 40% to 65%, while the x-axis uses logarithmic scaling (powers of 2). All lines show distinct trends, with some plateauing early and others improving significantly with larger representations.
### Components/Axes
- **X-axis (Representation Size)**: Logarithmic scale from 8 to 2048 (steps: 8, 16, 32, 64, 128, 256, 512, 1024, 2048).
- **Y-axis (mAP@10%)**: Linear scale from 40% to 65%.
- **Legend**: Located in the top-right corner, mapping colors and line styles to methods:
- **MRL**: Blue solid line with circles.
- **MRL-E**: Orange dashed line with triangles.
- **FF**: Green dash-dot line with downward triangles.
- **SVD**: Red dotted line with hexagons.
- **Slim. Net**: Purple dash-dot line with crosses.
- **Rand. FS**: Brown solid line with crosses.
### Detailed Analysis
1. **MRL (Blue)**: Starts at ~57% at 8, rises sharply to ~64% by 16, then plateaus. Maintains ~64% across all larger sizes.
2. **MRL-E (Orange)**: Begins at ~52% at 8, increases to ~63% by 16, then plateaus. Slightly below MRL but stable.
3. **FF (Green)**: Starts at ~54% at 8, peaks at ~63% at 16, then dips slightly (~62%) by 2048.
4. **SVD (Red)**: Begins at ~50% at 8, rises to ~62% by 128, then dips to ~60% by 2048.
5. **Slim. Net (Purple)**: Starts at ~53% at 8, peaks at ~61% at 128, then declines to ~58% by 2048.
6. **Rand. FS (Brown)**: Starts at ~40% at 8, rises sharply to ~63% by 2048, showing the steepest improvement.
### Key Observations
- **Early Performance**: MRL and MRL-E dominate at smaller representation sizes (8–16), achieving ~64% mAP@10%.
- **Scalability**: Rand. FS improves dramatically with larger representations, suggesting it benefits from increased data.
- **Dips**: SVD and Slim. Net show performance declines after 128, possibly due to overfitting or inefficiency at higher sizes.
- **Consistency**: MRL and MRL-E maintain stable performance across all sizes, indicating robustness.
### Interpretation
The data suggests that **MRL and MRL-E** are the most efficient methods for small-to-medium representation sizes, while **Rand. FS** excels with larger datasets. The decline in SVD and Slim. Net at higher sizes may indicate suboptimal scaling or overfitting. The logarithmic x-axis highlights that performance gains are most pronounced in the early stages for most methods, except Rand. FS, which shows linear improvement. This could imply that Rand. FS is better suited for high-dimensional data, whereas MRL/MRL-E are optimized for compact representations.