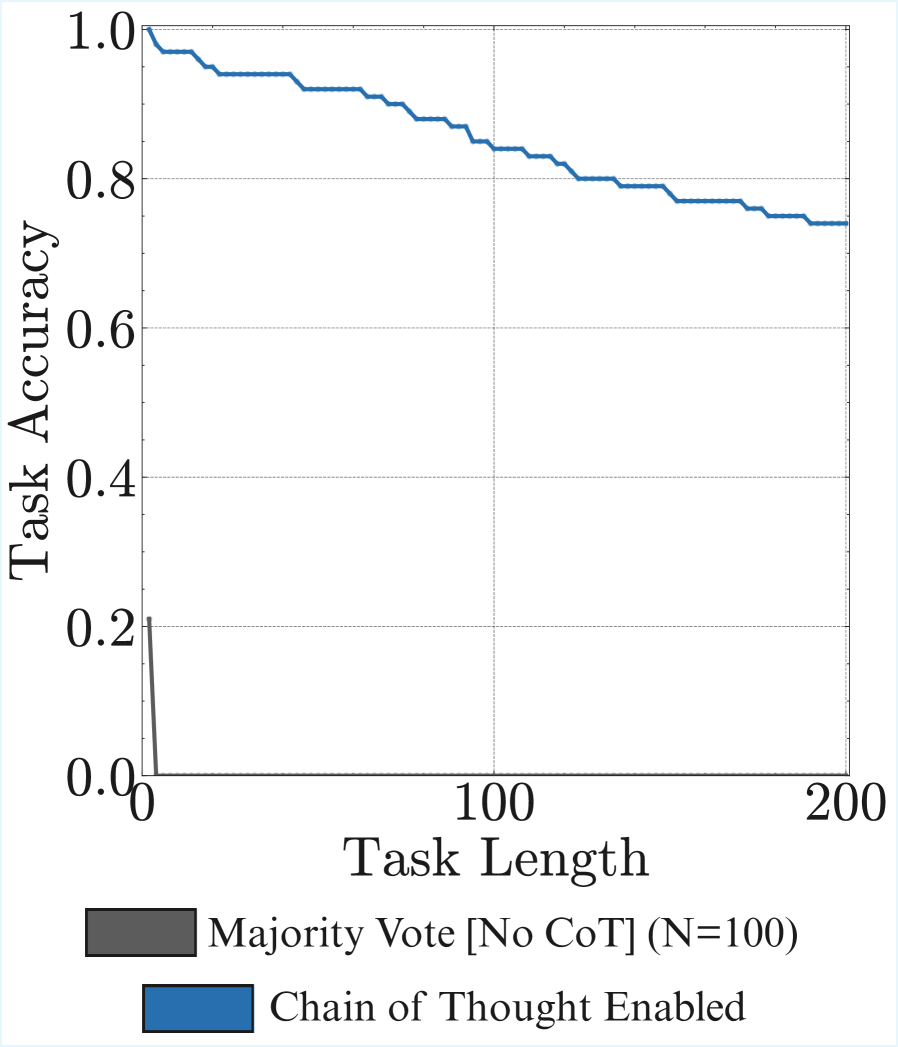
# Technical Data Extraction: Task Accuracy vs. Task Length
## 1. Component Isolation
* **Header:** None present.
* **Main Chart:** A 2D line graph plotting "Task Accuracy" against "Task Length". It features a grid with dashed lines and two distinct data series.
* **Footer (Legend):** Located at the bottom of the image, containing two labeled color swatches.
---
## 2. Axis and Metadata Extraction
* **Y-Axis Label:** Task Accuracy
* **Y-Axis Scale:** 0.0 to 1.0 (increments of 0.2 marked, with minor ticks every 0.1).
* **X-Axis Label:** Task Length
* **X-Axis Scale:** 0 to 200 (increments of 100 marked, with minor ticks every 50).
* **Grid:** Horizontal and vertical dashed lines at major intervals (0.2, 0.4, 0.6, 0.8 on Y; 100 on X).
---
## 3. Legend and Series Identification
The legend is located at the bottom of the frame.
| Color | Label | Spatial Grounding [x, y] |
| :--- | :--- | :--- |
| **Dark Grey** | Majority Vote [No CoT] (N=100) | Bottom Left |
| **Blue** | Chain of Thought Enabled | Bottom Right |
---
## 4. Trend Verification and Data Extraction
### Series 1: Majority Vote [No CoT] (N=100)
* **Visual Trend:** The line starts at a low accuracy (approx. 0.2) and immediately drops sharply to 0.0 within a very short task length (less than 10).
* **Key Data Points:**
* **Length 0:** ~0.21 Accuracy
* **Length ~5:** 0.0 Accuracy
* **Observation:** This method fails almost immediately as task complexity/length increases.
### Series 2: Chain of Thought Enabled
* **Visual Trend:** The line starts at perfect accuracy (1.0) and exhibits a gradual, "stair-step" downward slope as task length increases. It maintains high performance throughout the entire range shown.
* **Key Data Points (Approximate):**
* **Length 0:** 1.0 Accuracy
* **Length 50:** ~0.92 Accuracy
* **Length 100:** ~0.84 Accuracy
* **Length 150:** ~0.78 Accuracy
* **Length 200:** ~0.74 Accuracy
* **Observation:** Accuracy remains above 70% even at the maximum task length of 200, demonstrating significant robustness compared to the "No CoT" baseline.
---
## 5. Summary of Findings
The chart illustrates a significant performance gap between two reasoning methods. The **Majority Vote [No CoT]** approach is unable to handle tasks beyond a negligible length, dropping to zero accuracy almost instantly. In contrast, the **Chain of Thought Enabled** approach shows a high degree of resilience; while accuracy does degrade as the task length increases, it follows a slow, linear-like decay, retaining roughly 74% accuracy at a task length of 200.