# Technical Document Extraction: Task Accuracy Analysis
## Image Description
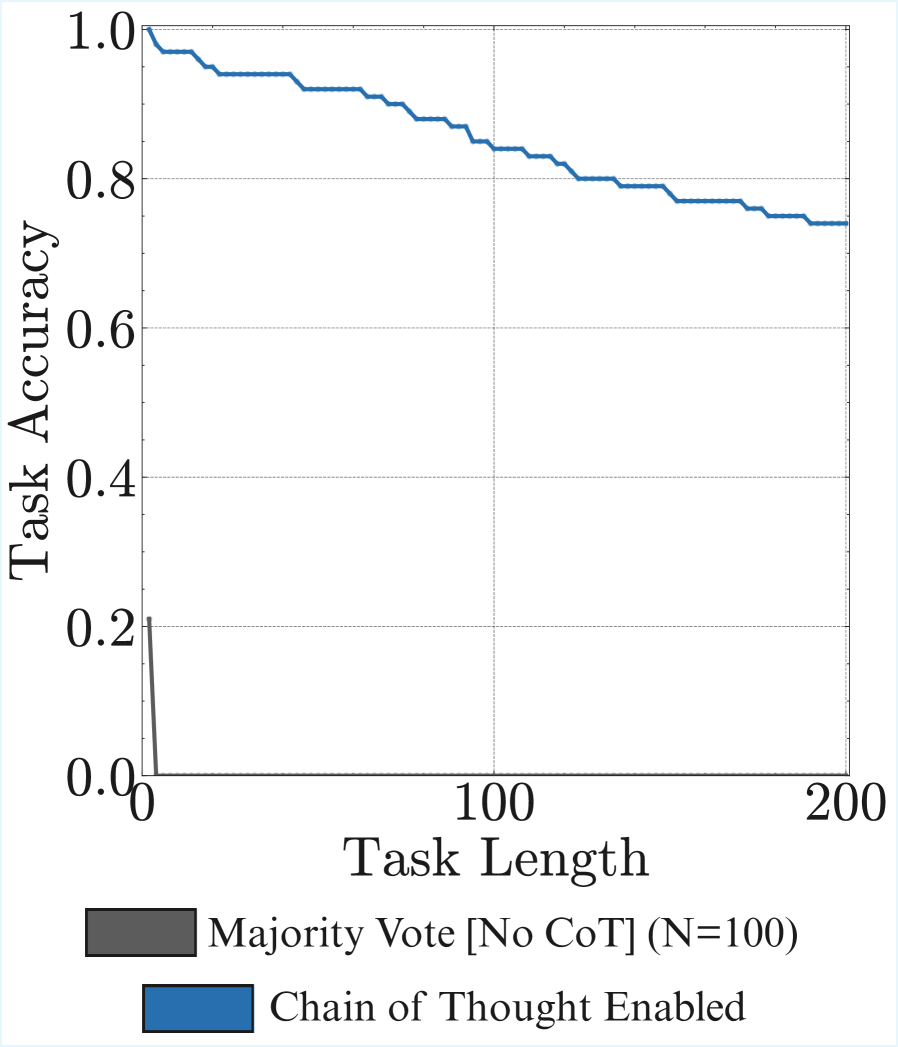
The image is a line graph titled **"Task Accuracy vs Task Length"**, comparing the performance of two methods: **Majority Vote [No CoT]** and **Chain of Thought Enabled**. The graph uses a grid background with dashed lines for reference.
---
### **Key Components**
1. **Axes**:
- **X-axis (Task Length)**:
- Labeled "Task Length".
- Markers at `0`, `100`, and `200`.
- Range: `0` to `200`.
- **Y-axis (Task Accuracy)**:
- Labeled "Task Accuracy".
- Markers at `0.0`, `0.2`, `0.4`, `0.6`, `0.8`, and `1.0`.
- Range: `0.0` to `1.0`.
2. **Legend**:
- Located at the bottom of the graph.
- **Colors**:
- `Gray`: Majority Vote [No CoT] (N=100).
- `Blue`: Chain of Thought Enabled.
3. **Data Series**:
- **Blue Line (Chain of Thought Enabled)**:
- Starts at `1.0` task accuracy at `Task Length = 0`.
- Gradually declines to approximately `0.75` at `Task Length = 200`.
- Trend: **Steady downward slope** with minor fluctuations.
- **Gray Line (Majority Vote [No CoT])**:
- Starts at `0.2` task accuracy at `Task Length = 0`.
- Remains constant at `0.2` for all subsequent task lengths.
- Trend: **Immediate and sustained drop** to a low value.
---
### **Trend Verification**
- **Blue Line (Chain of Thought Enabled)**:
- Visual trend: Slopes downward gradually.
- Data points (approximate):
- `Task Length = 0`: `1.0`
- `Task Length = 100`: `0.85`
- `Task Length = 200`: `0.75`
- **Gray Line (Majority Vote [No CoT])**:
- Visual trend: Sharp drop to `0.2` at `Task Length = 0`, then flat.
- Data points:
- `Task Length = 0`: `0.2`
- `Task Length = 100`: `0.2`
- `Task Length = 200`: `0.2`
---
### **Spatial Grounding**
- **Legend Position**: Bottom-center of the graph.
- **Line Colors**:
- Blue (`Chain of Thought Enabled`) matches the blue line.
- Gray (`Majority Vote [No CoT]`) matches the gray line.
---
### **Additional Observations**
- The graph includes a grid with dashed lines for reference.
- No other textual or numerical data is present in the image.
- The blue line consistently outperforms the gray line across all task lengths.
---
### **Conclusion**
The graph demonstrates that **Chain of Thought Enabled** maintains significantly higher task accuracy compared to **Majority Vote [No CoT]**, which experiences a drastic and sustained decline in performance. The blue line (Chain of Thought) retains ~75% accuracy at maximum task length, while the gray line (Majority Vote) remains at ~20%.