## Diagram: Dimensionality Reduction Process Across Groups
### Overview
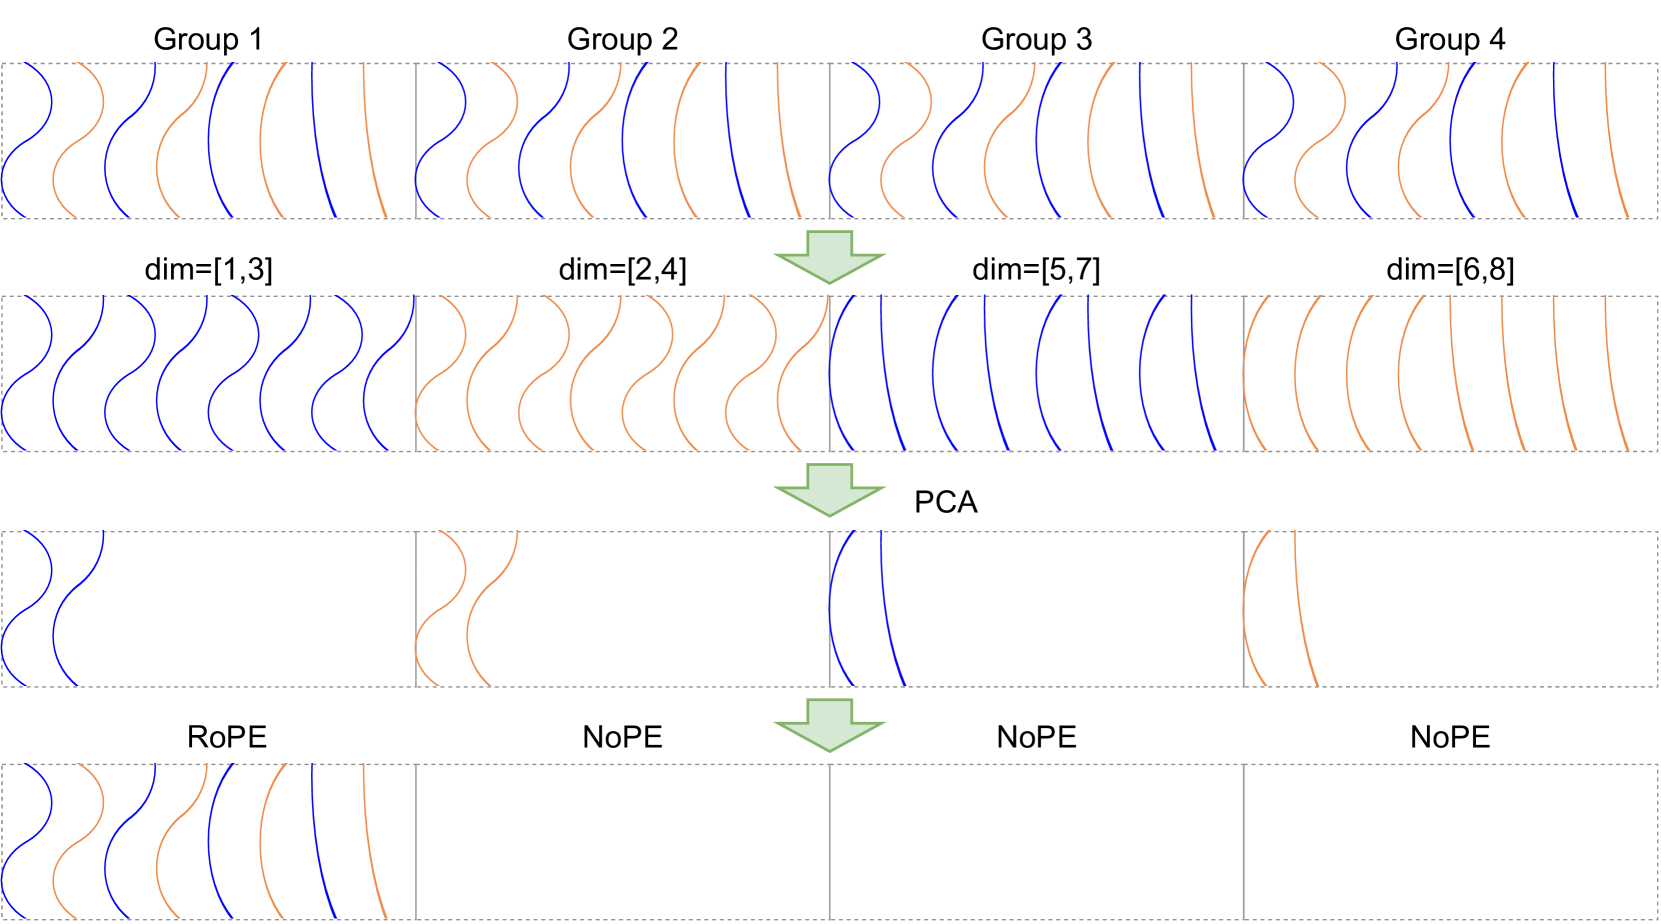
The diagram illustrates a multi-stage dimensionality reduction workflow applied to four distinct groups (Group 1–4). It visualizes how data represented by wavy lines (blue and orange) is transformed through Principal Component Analysis (PCA) into two outcomes: RoPE (Retained Principal Components) and NoPE (Discarded Components). The process emphasizes how dimensionality constraints (e.g., dim=[1,3]) influence the retention or elimination of features.
---
### Components/Axes
1. **Groups**:
- Four horizontal bands labeled **Group 1** to **Group 4**, each with wavy lines in **blue** and **orange**.
- Dimensions specified below each group:
- Group 1: `dim=[1,3]`
- Group 2: `dim=[2,4]`
- Group 3: `dim=[5,7]`
- Group 4: `dim=[6,8]`
2. **PCA Stage**:
- Arrows point downward from the groups to a central **PCA** block.
- PCA processes the input data, reducing dimensionality.
- Outputs split into **RoPE** (Retained) and **NoPE** (Discarded).
3. **RoPE/NoPE Outcomes**:
- **RoPE**: Contains simplified wavy lines (blue/orange) in Group 1 and Group 2.
- **NoPE**: Empty for Groups 3 and 4, with only partial lines in Group 1 and Group 2.
---
### Detailed Analysis
1. **Group-Specific Dimensionality**:
- Groups 1–2 have overlapping dimension ranges (`[1,3]` and `[2,4]`), suggesting incremental complexity.
- Groups 3–4 use higher dimensions (`[5,7]` and `[6,8]`), indicating denser data representations.
2. **Line Color Consistency**:
- **Blue lines** dominate all stages, while **orange lines** appear only in Groups 1–2 and RoPE for Group 1.
- No orange lines in PCA or NoPE sections, implying orange features are either filtered out or not retained.
3. **PCA Transformation**:
- Groups 1–2 retain partial data in RoPE (e.g., Group 1 RoPE retains orange lines).
- Groups 3–4 produce **NoPE** with no retained lines, suggesting complete dimensional collapse.
4. **NoPE Behavior**:
- Groups 3–4 have **NoPE** blocks with no lines, indicating all components are discarded.
- Group 1’s NoPE retains a single orange line, while Group 2’s NoPE retains one blue line.
---
### Key Observations
- **Dimensionality Impact**: Higher-dimensional groups (3–4) fully collapse to NoPE, while lower-dimensional groups (1–2) retain partial data in RoPE.
- **Color Significance**: Orange lines are selectively retained in RoPE for Group 1, suggesting they represent critical features in lower dimensions.
- **PCA Efficiency**: PCA aggressively discards data in higher-dimensional groups, leaving NoPE empty.
---
### Interpretation
This diagram demonstrates how PCA reduces data complexity across groups with varying dimensionality. The retention of orange lines in Group 1’s RoPE implies these features are preserved as principal components, while their absence in higher-dimensional groups (3–4) highlights the trade-off between dimensionality and feature retention. The empty NoPE blocks for Groups 3–4 suggest that PCA eliminates all non-principal components in these cases, potentially losing nuanced information. The workflow underscores the importance of dimension selection in balancing data compression and feature preservation.