## Line Chart: mAP on OpenMIC (VGGish)
### Overview
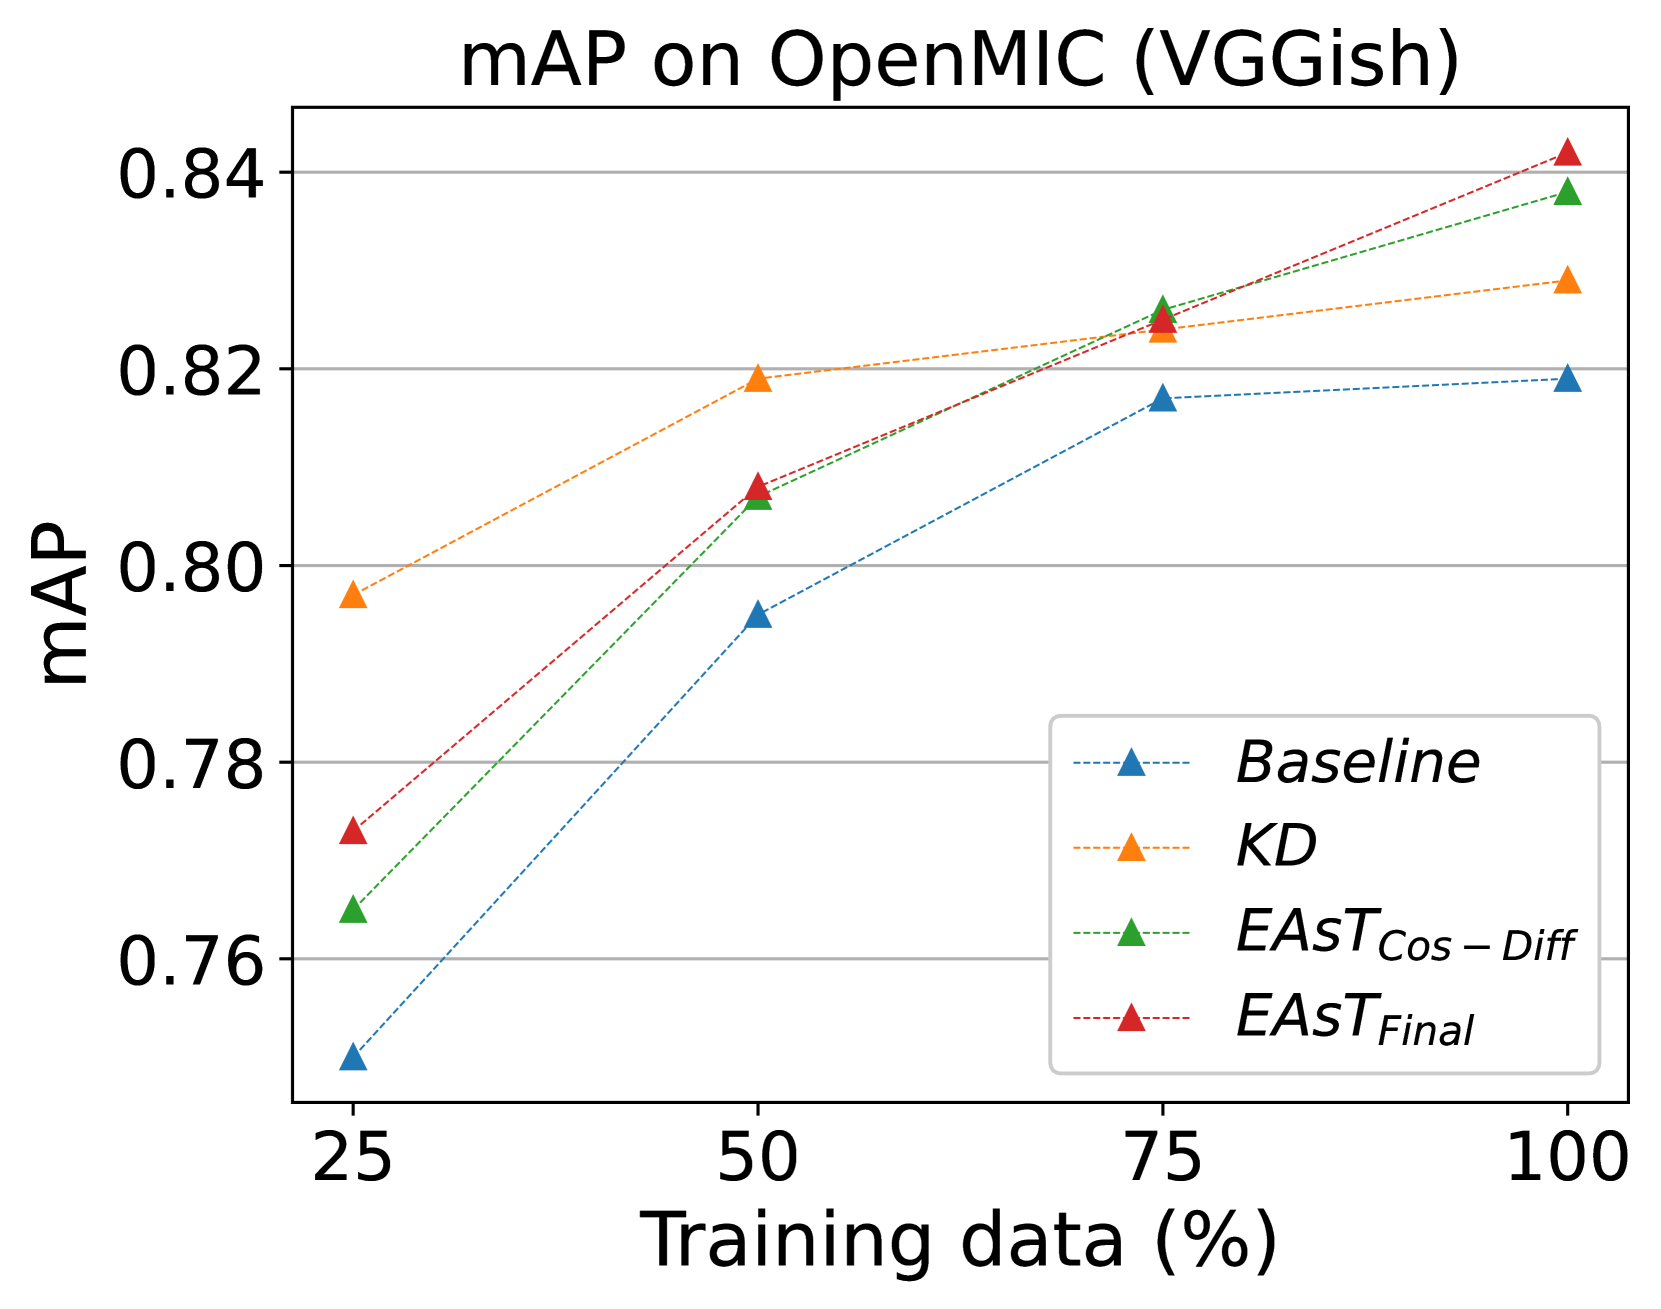
The chart illustrates the relationship between training data percentage (25% to 100%) and mean Average Precision (mAP) for four different models on the OpenMIC dataset using VGGish. Four data series are plotted with distinct line styles and markers, showing performance trends as training data increases.
### Components/Axes
- **X-axis**: Training data (%)
- Scale: 25 → 100 (increments of 25%)
- Labels: 25, 50, 75, 100
- **Y-axis**: mAP
- Scale: 0.76 → 0.84 (increments of 0.02)
- Labels: 0.76, 0.78, 0.80, 0.82, 0.84
- **Legend**: Bottom-right corner
- Entries:
- Baseline (blue dashed line + triangle markers)
- KD (orange dotted line + triangle markers)
- EAST_Cos-Diff (green dash-dot line + triangle markers)
- EAST_Final (red dotted line + triangle markers)
### Detailed Analysis
1. **Baseline (blue)**:
- Starts at ~0.75 (25% training data)
- Increases steadily to ~0.82 (100% training data)
- Slope: Gradual upward trend
2. **KD (orange)**:
- Starts at ~0.795 (25% training data)
- Rises to ~0.83 (100% training data)
- Slope: Steeper than Baseline, consistent growth
3. **EAST_Cos-Diff (green)**:
- Starts at ~0.765 (25% training data)
- Peaks at ~0.84 (100% training data)
- Slope: Sharp initial rise, plateaus slightly after 50%
4. **EAST_Final (red)**:
- Starts at ~0.775 (25% training data)
- Ends at ~0.845 (100% training data)
- Slope: Steepest ascent, surpasses all other lines by 100%
### Key Observations
- All models show improved mAP with increased training data.
- **EAST_Final** outperforms others at 100% training data (~0.845 vs. ~0.84 for EAST_Cos-Diff).
- **Baseline** has the lowest performance across all training percentages.
- **KD** and **EAST_Cos-Diff** converge near 0.83–0.84 at 100% training data.
- **EAST_Final** exceeds the y-axis maximum (0.84) at 100%, suggesting a potential outlier or measurement artifact.
### Interpretation
The data demonstrates that model architecture significantly impacts performance, with EAST variants (Cos-Diff and Final) achieving higher mAP than Baseline and KD. Training data percentage is a critical factor, but diminishing returns are observed after 75% for most models. The EAST_Final model’s superior performance suggests it may incorporate advanced techniques (e.g., finalized training protocols or architectural optimizations) that outperform simpler methods like KD. The slight anomaly in EAST_Final’s 100% data point warrants further validation to confirm accuracy.