TECHNICAL ASSET FINGERPRINT
6609a3bd303a778441e4bd4e
Click to view fullscreen
Press ESC or click to close
FOUND IN PAPERS
EXPERT: gemini-2.0-flash VERSION 1
RUNTIME: nugit/gemini/gemini-2.0-flash
INTEL_VERIFIED
## Network Diagrams with Statistical Analysis
### Overview
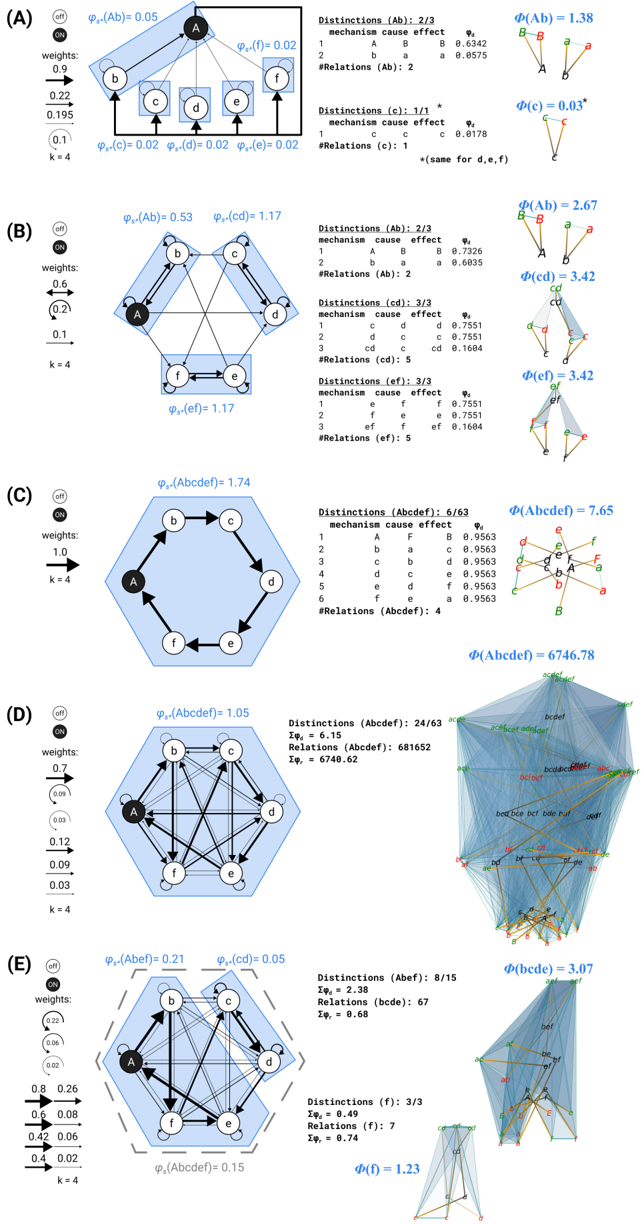
The image presents a series of five network diagrams (A-E), each depicting relationships between entities labeled A through F. Each diagram includes a network visualization, statistical data about the network's structure and relationships, and a 3D representation of the network. The diagrams explore how different weighting schemes affect network properties.
### Components/Axes
Each section (A-E) contains the following elements:
1. **Network Diagram:** A directed graph showing relationships between nodes labeled A, B, C, D, E, and F. Node A is consistently highlighted in black. Arrows indicate the direction of relationships. The thickness of the arrows varies, presumably indicating the strength or weight of the relationship. The nodes are arranged in different geometric configurations (linear, hexagonal, etc.). The nodes are contained within a larger shape (rectangle or hexagon) that is shaded blue.
2. **Weighting Scheme:** A vertical list of weights associated with the network. These weights appear to influence the connections within the network. An "on/off" toggle is present.
3. **Statistical Data:** Textual data providing statistical analysis of the network, including "Distinctions," "Relations," and calculated values (Σφ, Σφ,).
4. **Formulaic Representation:** A formulaic representation of the network, such as φ..(Ab) = 0.05.
5. **3D Representation:** A 3D visualization of a portion of the network, showing relationships as lines connecting nodes.
6. **Section Label:** A letter (A, B, C, D, E) in a circle, labeling each section.
### Detailed Analysis or ### Content Details
Here's a breakdown of each section:
**(A)**
* **Network Diagram:** Nodes A, B, C, D, E, and F are arranged linearly. Node A is black. Arrows indicate relationships: A -> B, B -> B, C -> C, D -> D, E -> E, F -> F, and A -> F.
* **Weighting Scheme:** Weights are 0.9, 0.22, 0.195, and 0.1. k=4.
* **Statistical Data:**
* Distinctions (Ab): 2/3. Mechanism cause effect: 1: A -> B (φ = 0.6342), 2: B -> A (φ = 0.0575). #Relations (Ab): 2.
* Distinctions (c): 1/1. Mechanism cause effect: 1: c -> c (φ = 0.0178). #Relations (c): 1. *(same for d, e, f)*
* **Formulaic Representation:** φ..(Ab) = 0.05, φ..(f) = 0.02, φ..(c) = 0.02, φ..(d) = 0.02, φ..(e) = 0.02
* **3D Representation:** Nodes A, B, and C are shown. Φ(Ab) = 1.38, Φ(c) = 0.03*.
**(B)**
* **Network Diagram:** Nodes A, B, C, D, E, and F are arranged in a hexagon. Node A is black. Arrows indicate relationships: A -> B, B -> C, C -> D, D -> E, E -> F, F -> A, B -> B, C -> C, D -> D, E -> E, F -> F.
* **Weighting Scheme:** Weights are 0.6, 0.2, and 0.1. k=4.
* **Statistical Data:**
* Distinctions (Ab): 2/3. Mechanism cause effect: 1: A -> B (φ = 0.7326), 2: B -> A (φ = 0.6035). #Relations (Ab): 2.
* Distinctions (cd): 3/3. Mechanism cause effect: 1: c -> d (φ = 0.7551), 2: d -> c (φ = 0.7551), 3: cd -> cd (φ = 0.1684). #Relations (cd): 5.
* Distinctions (ef): 3/3. Mechanism cause effect: 1: e -> f (φ = 0.7551), 2: f -> e (φ = 0.7551), 3: ef -> ef (φ = 0.1684). #Relations (ef): 5.
* **Formulaic Representation:** φ..(Ab) = 0.53, φ..(cd) = 1.17, φ..(ef) = 1.17.
* **3D Representation:** Nodes A, B, cd, and ef are shown. Φ(Ab) = 2.67, Φ(cd) = 3.42, Φ(ef) = 3.42.
**(C)**
* **Network Diagram:** Nodes A, B, C, D, E, and F are arranged in a hexagon. Node A is black. Arrows indicate relationships: A -> B, B -> C, C -> D, D -> E, E -> F, F -> A.
* **Weighting Scheme:** Weight is 1.0. k=4.
* **Statistical Data:**
* Distinctions (Abcdef): 6/63. Mechanism cause effect: 1: A -> F (φ = 0.9563), 2: B -> A (φ = 0.9563), 3: C -> B (φ = 0.9563), 4: D -> C (φ = 0.9563), 5: E -> D (φ = 0.9563), 6: F -> E (φ = 0.9563). #Relations (Abcdef): 4.
* **Formulaic Representation:** φ..(Abcdef) = 1.74.
* **3D Representation:** Nodes A, B, C, D, E, and F are shown. Φ(Abcdef) = 7.65.
**(D)**
* **Network Diagram:** Nodes A, B, C, D, E, and F are arranged in a hexagon. Node A is black. Arrows indicate relationships between all nodes.
* **Weighting Scheme:** Weights are 0.7, 0.12, 0.09, 0.03. k=4.
* **Statistical Data:**
* Distinctions (Abcdef): 24/63. Σφ = 6.15. Relations (Abcdef): 681652. Σφ, = 6740.62.
* **Formulaic Representation:** φ..(Abcdef) = 1.05.
* **3D Representation:** A complex network of nodes and connections is shown. Φ(Abcdef) = 6746.78. Several labels are present, including "acadef", "bdef", "bcdef", "aceficer", "abcdef", "bed bce bcf bde buf", and "def".
**(E)**
* **Network Diagram:** Nodes A, B, C, D, E, and F are arranged in a hexagon. Node A is black. Arrows indicate relationships between some nodes. The hexagon is dashed.
* **Weighting Scheme:** Weights are 0.8, 0.6, 0.42, 0.4, 0.26, 0.08, 0.06, 0.02. k=4.
* **Statistical Data:**
* Distinctions (Abef): 8/15. Σφ = 2.38. Relations (bcde): 67. Σφ, = 0.68.
* Distinctions (f): 3/3. Σφ = 0.49. Relations (f): 7. Σφ, = 0.74.
* **Formulaic Representation:** φ..(Abef) = 0.21, φ..(cd) = 0.05, φ..(Abcdef) = 0.15.
* **3D Representation:** Nodes b, c, d, e, and f are shown. Φ(bcde) = 3.07, Φ(f) = 1.23.
### Key Observations
* Node A is consistently highlighted, suggesting its importance in the network.
* The complexity of the network diagrams increases from (A) to (D), with (E) showing a partial network.
* The statistical data provides quantitative measures of the network's structure and relationships.
* The 3D representations offer a different perspective on the network's connectivity.
* The weighting schemes appear to influence the network's structure and statistical properties.
### Interpretation
The image presents a study of network dynamics, exploring how different weighting schemes and connection patterns affect network properties. The statistical data provides a quantitative assessment of these effects. The diagrams suggest an investigation into how changes in network structure influence overall network behavior. The progression from simple to complex networks, and then to a partial network, indicates a systematic exploration of network characteristics. The consistent highlighting of node A suggests it plays a central role in the network's function. The statistical measures (Distinctions, Relations, Σφ, Σφ,) likely quantify different aspects of network connectivity and information flow. The 3D representations provide a visual aid for understanding the network's spatial organization.
DECODING INTELLIGENCE...
EXPERT: nemotron-free VERSION 1
RUNTIME: free/nvidia/nemotron-nano-12b-v2-vl:free
INTEL_VERIFIED
## Multi-Panel Diagram: Network Analysis of Node Relationships and Probabilities
### Overview
The image presents a multi-panel technical diagram analyzing node relationships, probabilities, and statistical distributions across five scenarios (A–E). Each panel includes:
1. A network diagram with nodes and weighted edges.
2. A table detailing distinctions, relations, and mechanism cause effects.
3. A graph visualizing probability distributions.
### Components/Axes
#### Panel A
- **Diagram**: Nodes A, B, C, D, F with probabilities (e.g., φ(A,B)=0.05, φ(A,C)=0.02). Weights range from 0.195 to 0.9.
- **Table**:
- **Distinctions**: AB (2/3), AC (1/1), BC (1/1).
- **Relations**: AB (2), AC (1), BC (1).
- **Mechanism Cause Effect**: AB (0.6342), AC (0.6342), BC (0.6342).
- **Graph**: Nodes A, B, C with probabilities (φ(A,B)=1.38, φ(A,C)=0.03).
#### Panel B
- **Diagram**: Nodes A, B, C, D, E, F with probabilities (e.g., φ(A,B)=0.53, φ(C,D)=1.17). Weights range from 0.1 to 0.6.
- **Table**:
- **Distinctions**: AB (2/3), AC (1/1), BC (1/1), AD (1/1), AE (1/1), AF (1/1).
- **Relations**: AB (2), AC (1), BC (1), AD (1), AE (1), AF (1).
- **Mechanism Cause Effect**: AB (0.7226), AC (0.7226), BC (0.7226), AD (0.7226), AE (0.7226), AF (0.7226).
- **Graph**: Nodes A, B, C, D, E, F with probabilities (φ(A,B)=2.67, φ(C,D)=3.42).
#### Panel C
- **Diagram**: Hexagonal network (A–F) with probabilities (φ(A,B,C,D,E,F)=1.74). Weights range from 0.1 to 1.0.
- **Table**:
- **Distinctions**: ABCDEF (6/6).
- **Relations**: ABCDEF (6).
- **Mechanism Cause Effect**: ABCDEF (0.9563).
- **Graph**: Triangle with nodes A, B, C, D, E, F and probabilities (φ(A,B,C,D,E,F)=7.65).
#### Panel D
- **Diagram**: Complex hexagonal network with dense connections (e.g., φ(A,B,C,D,E,F)=1.05). Weights range from 0.03 to 0.7.
- **Table**:
- **Distinctions**: ABCDEF (24/63).
- **Relations**: ABCDEF (681652).
- **Mechanism Cause Effect**: ABCDEF (0.9563).
- **Graph**: 3D-like structure with nodes A, B, C, D, E, F and probabilities (φ(A,B,C,D,E,F)=6746.78).
#### Panel E
- **Diagram**: Hexagonal network with negative probability (φ(A,B,C,D,E,F)=−0.15). Weights range from 0.02 to 0.26.
- **Table**:
- **Distinctions**: ABEF (8/15), BCDE (2/3).
- **Relations**: ABEF (8), BCDE (2).
- **Mechanism Cause Effect**: ABEF (0.640), BCDE (0.640).
- **Graph**: Triangle with nodes B, C, D, E, F with probabilities (φ(B,C,D,E,F)=3.07).
### Key Observations
1. **Panel A**: High probability (φ(A,B)=1.38) between A and B, but low weight (0.195).
2. **Panel B**: Consistent mechanism cause effects (0.7226) across all node pairs.
3. **Panel C**: Maximum distinctions (6/6) and relations (6), suggesting full connectivity.
4. **Panel D**: Extremely high relations (681,652) despite low distinctions (24/63), indicating complex interdependencies.
5. **Panel E**: Negative probability (φ(A,B,C,D,E,F)=−0.15) and sparse connections.
### Interpretation
- **Trends**:
- Panels A–C show increasing complexity in node relationships, with probabilities rising from 0.05 to 7.65.
- Panel D’s explosion in relations (681,652) suggests a system where interactions scale exponentially with node count.
- Panel E’s negative probability and sparse connections imply instability or failure in the network.
- **Relationships**:
- Mechanism cause effects (e.g., 0.6342 in Panel A) correlate with distinctions and relations, indicating probabilistic dependencies.
- The 3D graph in Panel D visually reinforces the high dimensionality of the system.
- **Anomalies**:
- Panel E’s negative probability (−0.15) contradicts typical probabilistic models, suggesting an error or edge case.
- Panel D’s 681,652 relations far exceed the 24/63 distinctions, highlighting a potential data inconsistency or intentional design choice.
- **Significance**:
- The diagrams and tables collectively model how node interactions and probabilities evolve under varying constraints, with Panel D representing a critical threshold for system complexity.
- The use of color-coded legends (blue, green, red) in graphs aligns with node types, aiding in visual differentiation.
DECODING INTELLIGENCE...