## Multi-Panel Diagram: Network Analysis of Node Relationships and Probabilities
### Overview
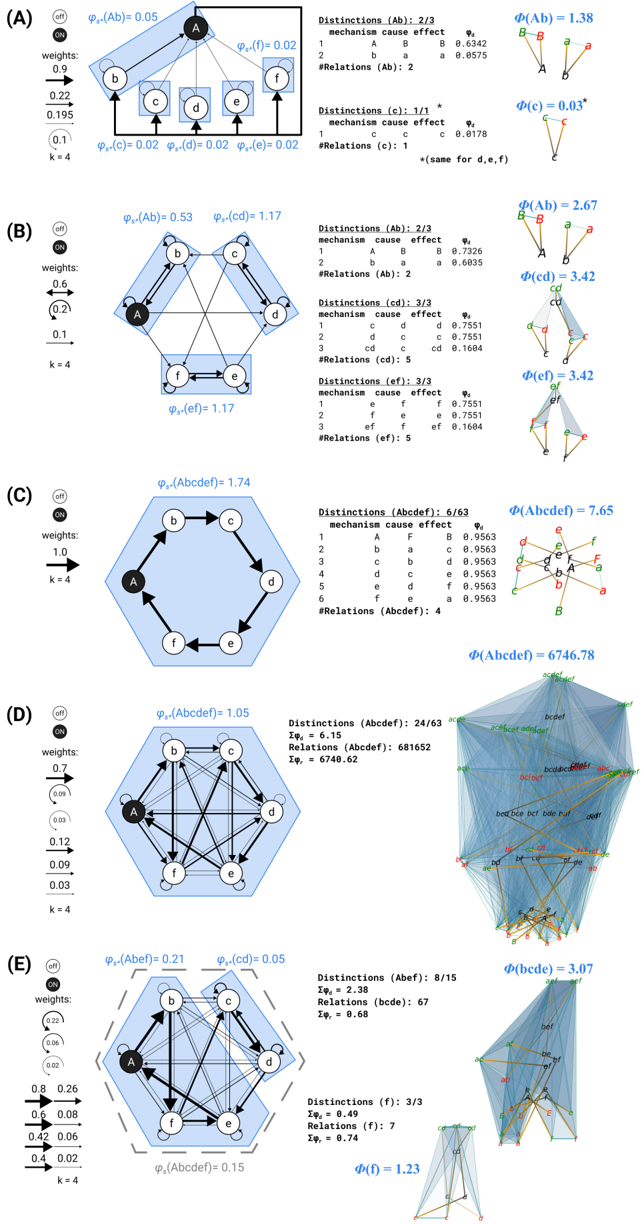
The image presents a multi-panel technical diagram analyzing node relationships, probabilities, and statistical distributions across five scenarios (A–E). Each panel includes:
1. A network diagram with nodes and weighted edges.
2. A table detailing distinctions, relations, and mechanism cause effects.
3. A graph visualizing probability distributions.
### Components/Axes
#### Panel A
- **Diagram**: Nodes A, B, C, D, F with probabilities (e.g., φ(A,B)=0.05, φ(A,C)=0.02). Weights range from 0.195 to 0.9.
- **Table**:
- **Distinctions**: AB (2/3), AC (1/1), BC (1/1).
- **Relations**: AB (2), AC (1), BC (1).
- **Mechanism Cause Effect**: AB (0.6342), AC (0.6342), BC (0.6342).
- **Graph**: Nodes A, B, C with probabilities (φ(A,B)=1.38, φ(A,C)=0.03).
#### Panel B
- **Diagram**: Nodes A, B, C, D, E, F with probabilities (e.g., φ(A,B)=0.53, φ(C,D)=1.17). Weights range from 0.1 to 0.6.
- **Table**:
- **Distinctions**: AB (2/3), AC (1/1), BC (1/1), AD (1/1), AE (1/1), AF (1/1).
- **Relations**: AB (2), AC (1), BC (1), AD (1), AE (1), AF (1).
- **Mechanism Cause Effect**: AB (0.7226), AC (0.7226), BC (0.7226), AD (0.7226), AE (0.7226), AF (0.7226).
- **Graph**: Nodes A, B, C, D, E, F with probabilities (φ(A,B)=2.67, φ(C,D)=3.42).
#### Panel C
- **Diagram**: Hexagonal network (A–F) with probabilities (φ(A,B,C,D,E,F)=1.74). Weights range from 0.1 to 1.0.
- **Table**:
- **Distinctions**: ABCDEF (6/6).
- **Relations**: ABCDEF (6).
- **Mechanism Cause Effect**: ABCDEF (0.9563).
- **Graph**: Triangle with nodes A, B, C, D, E, F and probabilities (φ(A,B,C,D,E,F)=7.65).
#### Panel D
- **Diagram**: Complex hexagonal network with dense connections (e.g., φ(A,B,C,D,E,F)=1.05). Weights range from 0.03 to 0.7.
- **Table**:
- **Distinctions**: ABCDEF (24/63).
- **Relations**: ABCDEF (681652).
- **Mechanism Cause Effect**: ABCDEF (0.9563).
- **Graph**: 3D-like structure with nodes A, B, C, D, E, F and probabilities (φ(A,B,C,D,E,F)=6746.78).
#### Panel E
- **Diagram**: Hexagonal network with negative probability (φ(A,B,C,D,E,F)=−0.15). Weights range from 0.02 to 0.26.
- **Table**:
- **Distinctions**: ABEF (8/15), BCDE (2/3).
- **Relations**: ABEF (8), BCDE (2).
- **Mechanism Cause Effect**: ABEF (0.640), BCDE (0.640).
- **Graph**: Triangle with nodes B, C, D, E, F with probabilities (φ(B,C,D,E,F)=3.07).
### Key Observations
1. **Panel A**: High probability (φ(A,B)=1.38) between A and B, but low weight (0.195).
2. **Panel B**: Consistent mechanism cause effects (0.7226) across all node pairs.
3. **Panel C**: Maximum distinctions (6/6) and relations (6), suggesting full connectivity.
4. **Panel D**: Extremely high relations (681,652) despite low distinctions (24/63), indicating complex interdependencies.
5. **Panel E**: Negative probability (φ(A,B,C,D,E,F)=−0.15) and sparse connections.
### Interpretation
- **Trends**:
- Panels A–C show increasing complexity in node relationships, with probabilities rising from 0.05 to 7.65.
- Panel D’s explosion in relations (681,652) suggests a system where interactions scale exponentially with node count.
- Panel E’s negative probability and sparse connections imply instability or failure in the network.
- **Relationships**:
- Mechanism cause effects (e.g., 0.6342 in Panel A) correlate with distinctions and relations, indicating probabilistic dependencies.
- The 3D graph in Panel D visually reinforces the high dimensionality of the system.
- **Anomalies**:
- Panel E’s negative probability (−0.15) contradicts typical probabilistic models, suggesting an error or edge case.
- Panel D’s 681,652 relations far exceed the 24/63 distinctions, highlighting a potential data inconsistency or intentional design choice.
- **Significance**:
- The diagrams and tables collectively model how node interactions and probabilities evolve under varying constraints, with Panel D representing a critical threshold for system complexity.
- The use of color-coded legends (blue, green, red) in graphs aligns with node types, aiding in visual differentiation.