## Diagram: Evaluation Goals and Paradigm
### Overview
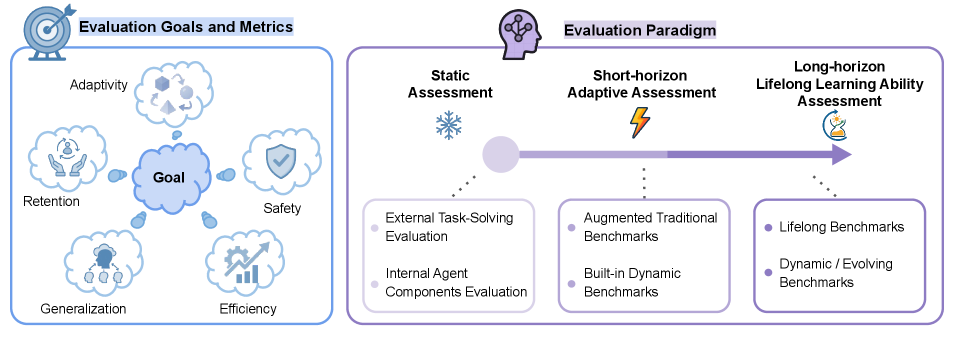
The image presents a diagram outlining evaluation goals and metrics on the left, and an evaluation paradigm on the right. The evaluation goals are structured around a central "Goal" with radiating metrics. The evaluation paradigm illustrates a progression from static assessment to short-horizon adaptive assessment, and finally to long-horizon lifelong learning ability assessment.
### Components/Axes
**Left Side: Evaluation Goals and Metrics**
* **Title:** Evaluation Goals and Metrics
* **Central Node:** Goal (represented by a cloud shape)
* **Surrounding Nodes (also cloud shapes):**
* Adaptivity (icon: rotating shapes)
* Retention (icon: hands holding people)
* Safety (icon: shield with a checkmark)
* Generalization (icon: head with connected nodes)
* Efficiency (icon: bar graph)
**Right Side: Evaluation Paradigm**
* **Title:** Evaluation Paradigm
* **Progression:** A horizontal arrow indicates the progression from left to right.
* **Stages:**
* Static Assessment (icon: snowflake)
* Short-horizon Adaptive Assessment (icon: lightning bolt)
* Long-horizon Lifelong Learning Ability Assessment (icon: hourglass with a plant growing out of it)
* **Assessment Types under each stage:**
* Static Assessment:
* External Task-Solving Evaluation
* Internal Agent Components Evaluation
* Short-horizon Adaptive Assessment:
* Augmented Traditional Benchmarks
* Built-in Dynamic Benchmarks
* Long-horizon Lifelong Learning Ability Assessment:
* Lifelong Benchmarks
* Dynamic / Evolving Benchmarks
### Detailed Analysis or ### Content Details
**Left Side: Evaluation Goals and Metrics**
* The "Goal" is the central focus, with arrows connecting it to the surrounding metrics.
* Each metric (Adaptivity, Retention, Safety, Generalization, Efficiency) is represented by a cloud shape containing a relevant icon.
**Right Side: Evaluation Paradigm**
* The paradigm progresses linearly from Static Assessment to Long-horizon Lifelong Learning Ability Assessment.
* Each assessment stage has specific types of evaluations or benchmarks associated with it.
* The arrow transitions from a lighter to a darker shade of purple, visually indicating the progression.
### Key Observations
* The diagram provides a high-level overview of evaluation goals and how they relate to different assessment paradigms.
* The progression in the evaluation paradigm suggests an increasing level of complexity and sophistication in the assessment methods.
* The icons used for each metric and assessment stage provide a visual representation of the concepts.
### Interpretation
The diagram illustrates a framework for evaluating AI systems, emphasizing both the goals of the system (Adaptivity, Retention, Safety, Generalization, Efficiency) and the methods used to assess its performance (Static, Adaptive, Lifelong Learning). The progression from static to lifelong learning assessment suggests a shift towards more comprehensive and dynamic evaluation approaches that consider the long-term capabilities of the system. The diagram highlights the importance of aligning evaluation methods with the specific goals of the AI system.