## Chart: Induction Success vs. Parameters
### Overview
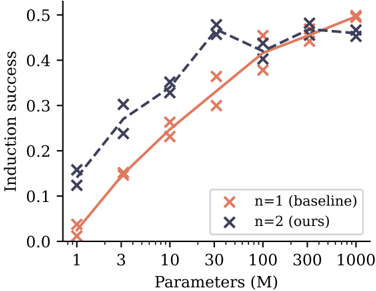
The image is a line chart comparing the induction success rate for two different models (n=1 baseline and n=2 ours) across varying parameter sizes (in millions). The x-axis represents the number of parameters, and the y-axis represents the induction success rate.
### Components/Axes
* **X-axis:** Parameters (M), with values 1, 3, 10, 30, 100, 300, 1000. The scale appears to be logarithmic.
* **Y-axis:** Induction success, ranging from 0.0 to 0.5 in increments of 0.1.
* **Legend:** Located on the right side of the chart.
* `x` (coral): n=1 (baseline)
* `x` (dark blue): n=2 (ours)
### Detailed Analysis
* **n=1 (baseline) - coral line:**
* The line starts at approximately (1, 0.02).
* At (3, 0.15), the line increases.
* At (10, 0.25), the line increases.
* At (30, 0.30), the line increases.
* At (100, 0.40), the line increases.
* At (300, 0.45), the line increases.
* At (1000, 0.47), the line increases.
* The trend is generally upward, with a decreasing rate of increase as the number of parameters grows.
* **n=2 (ours) - dark blue dashed line:**
* The line starts at approximately (1, 0.13).
* At (3, 0.27), the line increases.
* At (10, 0.34), the line increases.
* At (30, 0.45), the line increases.
* At (100, 0.42), the line decreases slightly.
* At (300, 0.48), the line increases.
* At (1000, 0.46), the line decreases slightly.
* The trend is generally upward, but with a slight dip around 100M parameters.
### Key Observations
* Both models show an increase in induction success as the number of parameters increases.
* The "n=2 (ours)" model generally outperforms the "n=1 (baseline)" model across all parameter sizes.
* The "n=2 (ours)" model shows a slight dip in performance around 100M parameters.
### Interpretation
The chart suggests that increasing the number of parameters in both models leads to improved induction success. The "n=2 (ours)" model consistently performs better than the "n=1 (baseline)" model, indicating that the modifications made in the "n=2" model are effective in improving induction success. The slight dip in performance for the "n=2 (ours)" model around 100M parameters could indicate a point of diminishing returns or a need for further optimization at that parameter scale.