## Line Chart: Induction Success vs. Model Parameters
### Overview
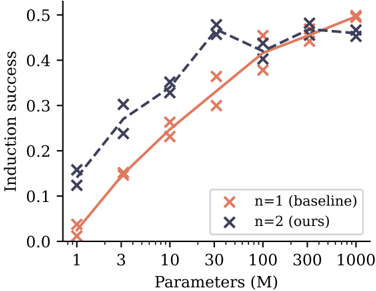
The image is a line chart comparing the performance of two models or methods, labeled "n=1 (baseline)" and "n=2 (ours)", across different model sizes. The chart plots "Induction success" (y-axis) against the number of model parameters in millions (x-axis), which uses a logarithmic scale. The data suggests an investigation into how scaling model size affects a specific capability ("induction") for a baseline approach versus a proposed method.
### Components/Axes
* **Chart Type:** Line chart with marked data points.
* **X-Axis:**
* **Label:** "Parameters (M)"
* **Scale:** Logarithmic.
* **Tick Marks/Values:** 1, 3, 10, 30, 100, 300, 1000.
* **Y-Axis:**
* **Label:** "Induction success"
* **Scale:** Linear, ranging from 0.0 to 0.5.
* **Tick Marks/Values:** 0.0, 0.1, 0.2, 0.3, 0.4, 0.5.
* **Legend:**
* **Position:** Bottom-right corner of the plot area.
* **Series 1:** Orange 'x' marker, labeled "n=1 (baseline)".
* **Series 2:** Dark blue 'x' marker, labeled "n=2 (ours)".
* **Data Series:** Two lines connecting 'x' markers. The orange line represents the baseline, and the dark blue line represents the authors' method.
### Detailed Analysis
**Data Series: n=1 (baseline) - Orange Line**
* **Trend:** Shows a steady, monotonic increase in induction success as the number of parameters grows. The slope is steepest between 1M and 30M parameters and begins to plateau after 100M.
* **Approximate Data Points:**
* 1M Parameters: ~0.03
* 3M Parameters: ~0.15
* 10M Parameters: ~0.23
* 30M Parameters: ~0.36
* 100M Parameters: ~0.38
* 300M Parameters: ~0.45
* 1000M Parameters: ~0.50
**Data Series: n=2 (ours) - Dark Blue Line**
* **Trend:** Starts at a higher success rate than the baseline for small models. It increases sharply to a peak at 30M parameters, then experiences a slight dip at 100M before recovering and plateauing. It does not show a clear advantage over the baseline at the largest model sizes (300M-1000M).
* **Approximate Data Points:**
* 1M Parameters: ~0.13
* 3M Parameters: ~0.27
* 10M Parameters: ~0.34
* 30M Parameters: ~0.47 (Peak)
* 100M Parameters: ~0.41 (Dip)
* 300M Parameters: ~0.48
* 1000M Parameters: ~0.46
### Key Observations
1. **Performance Crossover:** The "n=2 (ours)" method demonstrates significantly higher induction success than the baseline for small to medium-sized models (1M to 30M parameters). The advantage is most pronounced at 30M parameters.
2. **Diminishing Returns:** Both methods show diminishing returns as model size increases beyond 30M-100M parameters. The curves begin to flatten.
3. **Convergence at Scale:** At the largest model sizes (300M and 1000M parameters), the performance of the two methods converges, with both achieving an induction success rate between approximately 0.45 and 0.50.
4. **Non-Monotonic Behavior:** The "n=2" series exhibits a non-monotonic trend, with a noticeable dip in performance at 100M parameters before rising again. This could indicate an anomaly, a point of instability in training, or a characteristic of the method at that specific scale.
### Interpretation
This chart likely comes from a machine learning research paper. "Induction success" probably measures a model's ability to perform in-context learning or pattern completion. The data suggests the authors' proposed method ("n=2") is more **parameter-efficient**, achieving better performance with fewer computational resources (smaller models) compared to the baseline ("n=1").
The key finding is that the proposed method provides a substantial "head start" in capability at smaller scales. However, this advantage diminishes with brute-force scaling, as the baseline eventually catches up when given enough parameters (≥300M). This implies the authors' method may encode a more efficient algorithm or prior for the induction task, which becomes less critical as the model's raw capacity grows large enough to learn the task implicitly. The dip at 100M for the "n=2" method is an interesting anomaly that would warrant further investigation in the original research context.