## Line Graph: Induction Success vs. Parameters (M)
### Overview
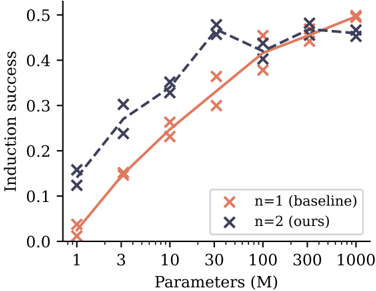
The image is a line graph comparing induction success rates across different parameter scales (M) for two models: a baseline model (n=1) and an optimized model (n=2). The graph shows how induction success improves with increasing parameters, with distinct trends for each model.
### Components/Axes
- **X-axis**: "Parameters (M)" with a logarithmic scale (1, 3, 10, 30, 100, 300, 1000).
- **Y-axis**: "Induction success" ranging from 0.0 to 0.5 in increments of 0.1.
- **Legend**: Located in the bottom-right corner, with:
- Red "x" markers for "n=1 (baseline)"
- Blue "x" markers for "n=2 (ours)"
- **Data Points**: Both lines use "x" symbols to denote measured values.
### Detailed Analysis
1. **Baseline Model (n=1, red)**:
- Starts at ~0.02 induction success at 1M parameters.
- Increases steadily, reaching ~0.48 at 1000M.
- Slope is linear, with no significant inflection points.
2. **Optimized Model (n=2, blue)**:
- Begins at ~0.15 induction success at 1M.
- Peaks at ~0.45 at 30M, then plateaus with minor fluctuations.
- At 1000M, induction success is ~0.47, slightly below its peak.
### Key Observations
- Both models show improved induction success with more parameters, but the optimized model (n=2) achieves higher performance at lower parameter scales.
- The baseline model (n=1) exhibits a consistent linear improvement, while the optimized model (n=2) demonstrates diminishing returns after 30M parameters.
- At 1000M parameters, the optimized model outperforms the baseline by ~0.01 (0.47 vs. 0.48), but the gap narrows at higher scales.
### Interpretation
The data suggests that increasing parameters generally enhances induction success, but the optimized model (n=2) achieves superior efficiency at smaller scales. The plateau in n=2’s performance after 30M implies potential architectural or algorithmic constraints, such as overfitting or computational limits. The baseline model’s linear trend indicates no such constraints but requires significantly more parameters to match the optimized model’s performance. This highlights a trade-off between parameter efficiency and scalability in model design.