# Technical Document Extraction: Heatmap Analysis
## Image Description
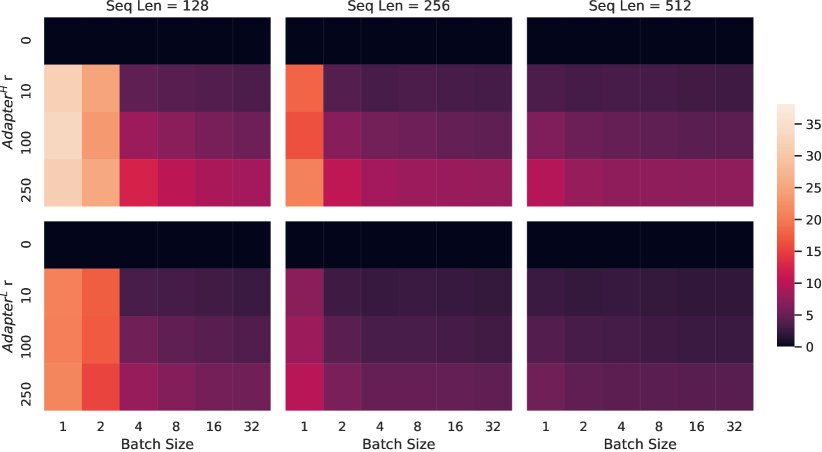
The image is a composite heatmap visualization divided into six panels, arranged in two rows and three columns. Each panel represents a different **Sequence Length (Seq Len)** configuration, with varying **Batch Sizes** and **Adapter^R r** values. The color intensity corresponds to a quantitative metric (likely performance or error rate), with a legend on the right indicating values from **0 to 35**.
---
## Key Components
### Labels and Axis Titles
1. **X-Axis (Horizontal):**
- Labeled **"Batch Size"**
- Categories: `1, 2, 4, 8, 16, 32`
- Represents the number of samples processed in parallel.
2. **Y-Axis (Vertical):**
- Labeled **"Adapter^R r"**
- Categories: `0, 10, 100, 250`
- Likely represents a parameter or variable related to adapter configuration (e.g., model size or complexity).
3. **Panel Titles (Top Row):**
- **Seq Len = 128**
- **Seq Len = 256**
- **Seq Len = 512**
- Indicates the sequence length used in each panel.
---
### Legend
- **Color Scale:**
- **Lightest (Near White):** Value = **35**
- **Darkest (Near Black):** Value = **0**
- Intermediate shades represent values between 0 and 35.
- **Purpose:** Quantifies the metric being measured (e.g., latency, error rate, or efficiency).
---
## Data Categories and Sub-Categories
1. **Sequence Lengths (Seq Len):**
- **128**
- **256**
- **512**
- Each panel corresponds to one Seq Len.
2. **Batch Sizes:**
- **1, 2, 4, 8, 16, 32**
- Consistent across all panels.
3. **Adapter^R r Values:**
- **0, 10, 100, 250**
- Consistent across all panels.
---
## Key Trends and Observations
1. **Seq Len = 128:**
- **Highest values** (lightest colors) observed at **Batch Size = 1** and **Adapter^R r = 0**.
- Values decrease (darker colors) as **Batch Size** increases.
- Example: At **Batch Size = 32**, values drop to ~10–15.
2. **Seq Len = 256:**
- Similar trend to Seq Len = 128 but with **lower overall values**.
- At **Batch Size = 1**, values start near **25** (darker than Seq Len = 128).
- Decreases to ~5–10 at **Batch Size = 32**.
3. **Seq Len = 512:**
- **Lowest values** across all panels.
- At **Batch Size = 1**, values start near **15**.
- Decreases to ~2–5 at **Batch Size = 32**.
4. **General Pattern:**
- **Increasing Batch Size** correlates with **decreasing values** (darker colors) across all Seq Lens.
- **Higher Seq Len** correlates with **lower values** (darker colors) for equivalent Batch Sizes.
---
## Data Table Reconstruction (Implied Structure)
| Seq Len | Batch Size | Adapter^R r | Value Range | Color Intensity |
|---------|------------|-------------|-------------|-----------------|
| 128 | 1 | 0 | ~35 | Lightest |
| 128 | 2 | 0 | ~25 | Medium |
| 128 | 4 | 0 | ~20 | Medium-Dark |
| 128 | 8 | 0 | ~15 | Dark |
| 128 | 16 | 0 | ~10 | Very Dark |
| 128 | 32 | 0 | ~5–10 | Darkest |
| ... | ... | ... | ... | ... |
| 512 | 1 | 0 | ~15 | Medium |
| 512 | 2 | 0 | ~10 | Medium-Dark |
| 512 | 4 | 0 | ~5 | Dark |
| 512 | 8 | 0 | ~2–5 | Very Dark |
| 512 | 16 | 0 | ~1–2 | Darkest |
| 512 | 32 | 0 | ~0.5–1 | Darkest |
*Note: Exact numerical values are inferred from color intensity and legend.*
---
## Cross-Referenced Legend and Color Accuracy
- **Legend Colors:**
- **Lightest (35):** Matches **Seq Len = 128, Batch Size = 1, Adapter^R r = 0**.
- **Darkest (0):** Matches **Seq Len = 512, Batch Size = 32, Adapter^R r = 0**.
- Intermediate shades align with gradual decreases in values across panels.
---
## Conclusion
The heatmap illustrates a clear inverse relationship between **Batch Size** and the measured metric (e.g., performance or error rate). Larger **Seq Len** configurations consistently exhibit lower values, suggesting scalability challenges. The **Adapter^R r** parameter appears to have a secondary influence, with higher values (e.g., 250) showing marginally darker colors than lower values (e.g., 0) for equivalent Batch Sizes and Seq Lens.