# Technical Data Extraction: Performance Heatmaps for Adapter Configurations
## 1. Document Overview
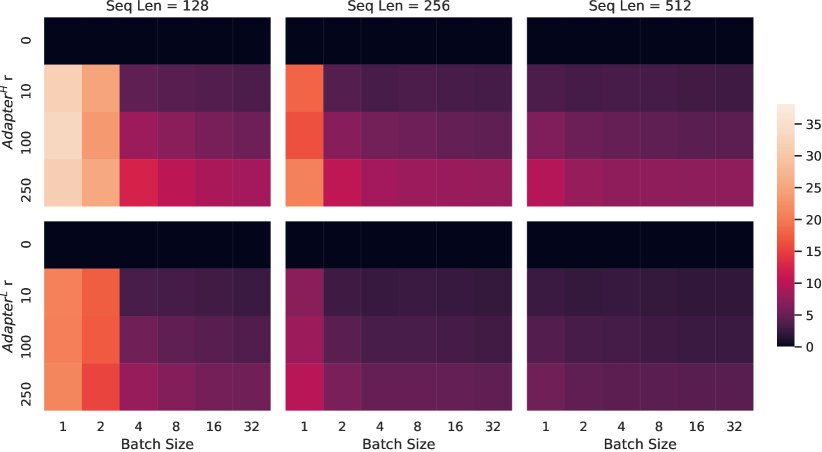
This image contains a grid of six heatmaps organized into two rows and three columns. The charts visualize the relationship between **Batch Size**, **Adapter Rank ($r$)**, and **Sequence Length** on a specific performance metric (likely memory usage or latency, given the scale).
## 2. Global Components and Scales
### Header (Column Titles)
The columns are categorized by Sequence Length:
* **Column 1:** `Seq Len = 128`
* **Column 2:** `Seq Len = 256`
* **Column 3:** `Seq Len = 512`
### Y-Axis (Row Categories)
The rows represent different adapter types:
* **Top Row:** $Adapter^H$ $r$
* **Bottom Row:** $Adapter^L$ $r$
* **Y-Axis Markers (Common to both rows):** `0`, `10`, `100`, `250` (representing the rank $r$).
### X-Axis (Common to all columns)
* **Label:** `Batch Size`
* **Markers:** `1`, `2`, `4`, `8`, `16`, `32`
### Legend (Color Bar)
* **Location:** Right side of the image.
* **Scale:** Linear, ranging from `0` (Dark Purple/Black) to `35` (Light Peach/White).
* **Visual Trend:** Higher values are represented by lighter, warmer colors (orange/peach), while lower values are represented by darker, cooler colors (dark purple/black).
---
## 3. Detailed Heatmap Analysis
### Row 1: $Adapter^H$ $r$
**General Trend:** Values increase as the Adapter Rank ($r$) increases and as the Sequence Length increases. However, values significantly decrease as the Batch Size increases (moving left to right).
#### Sub-chart: Seq Len = 128
* **r = 0:** Constant value of ~0 across all batch sizes (Black).
* **r = 10 to 250:** Highest values in the dataset are found here at Batch Size 1 and 2 (Peach/Orange, ~30-35). As Batch Size moves to 32, the color shifts to dark pink (~10-15).
#### Sub-chart: Seq Len = 256
* **r = 0:** Constant value of ~0.
* **r = 10 to 250:** Values are lower than the 128 Seq Len counterpart. Batch Size 1 shows orange (~20-25), transitioning quickly to dark purple (~5-10) by Batch Size 32.
#### Sub-chart: Seq Len = 512
* **r = 0:** Constant value of ~0.
* **r = 10 to 250:** The lowest values for the $Adapter^H$ row. Most cells are dark purple (~5-10), with only Batch Size 1 showing a slightly lighter magenta (~12).
---
### Row 2: $Adapter^L$ $r$
**General Trend:** This row follows the same pattern as the top row (higher $r$ = higher value; higher Batch Size = lower value) but the absolute values are consistently lower than $Adapter^H$.
#### Sub-chart: Seq Len = 128
* **r = 0:** Constant value of ~0.
* **r = 10 to 250:** Batch Size 1 and 2 show orange/red (~20-25). By Batch Size 32, the values drop to dark purple (~5).
#### Sub-chart: Seq Len = 256
* **r = 0:** Constant value of ~0.
* **r = 10 to 250:** Significant drop compared to Seq Len 128. Only Batch Size 1 shows a magenta hue (~10-12); all other batch sizes are near the bottom of the scale (Dark Purple, ~2-5).
#### Sub-chart: Seq Len = 512
* **r = 0:** Constant value of ~0.
* **r = 10 to 250:** The darkest heatmap in the set. Almost all values for $r > 0$ are uniform dark purple (~2-5), indicating minimal variance or very low performance impact at this high sequence length.
---
## 4. Summary of Key Findings
1. **Baseline:** When Adapter Rank $r = 0$, the metric is consistently at its minimum (~0) regardless of other parameters.
2. **Inverse Batch Relationship:** There is a strong inverse correlation between Batch Size and the measured metric; as Batch Size increases, the metric value decreases across all ranks and sequence lengths.
3. **Adapter Comparison:** $Adapter^H$ consistently produces higher values (lighter colors) than $Adapter^L$ across identical configurations.
4. **Sequence Length Impact:** Increasing the Sequence Length (from 128 to 512) leads to a overall decrease in the measured metric values across the board.