## Network Diagram: Interaction Graph
### Overview
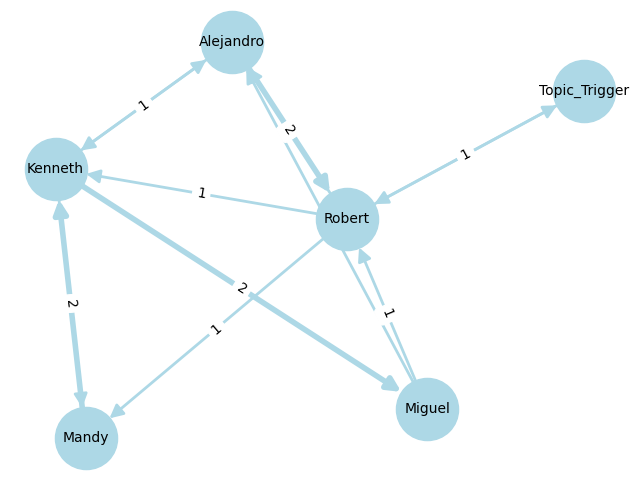
The image is a network diagram illustrating interactions between several entities. The entities are represented as light blue circles, and the interactions are represented as light blue arrows. The thickness of the arrows indicates the strength or frequency of the interaction, and the numbers adjacent to the arrows quantify the interaction strength.
### Components/Axes
* **Nodes:**
* Alejandro (top center)
* Kenneth (left center)
* Robert (center)
* Mandy (bottom left)
* Miguel (bottom right)
* Topic\_Trigger (top right)
* **Edges:** Directed arrows indicating the direction of interaction. The thickness of the arrow represents the weight of the interaction.
* **Edge Weights:** Numerical labels (1 or 2) indicating the strength or frequency of the interaction.
### Detailed Analysis
* **Alejandro:**
* Receives an interaction of weight 1 from Kenneth.
* Receives an interaction of weight 2 from Robert.
* **Kenneth:**
* Sends an interaction of weight 1 to Alejandro.
* Sends an interaction of weight 1 to Robert.
* Sends an interaction of weight 2 to Mandy.
* Receives an interaction of weight 2 from Mandy.
* **Robert:**
* Sends an interaction of weight 2 to Alejandro.
* Sends an interaction of weight 1 to Kenneth.
* Sends an interaction of weight 1 to Miguel.
* Sends an interaction of weight 1 to Topic\_Trigger.
* Receives an interaction of weight 1 from Miguel.
* **Mandy:**
* Sends an interaction of weight 2 to Kenneth.
* Receives an interaction of weight 2 from Kenneth.
* **Miguel:**
* Sends an interaction of weight 1 to Robert.
* Receives an interaction of weight 1 from Robert.
* **Topic\_Trigger:**
* Receives an interaction of weight 1 from Robert.
### Key Observations
* Robert appears to be a central node, interacting with all other nodes in the diagram.
* Kenneth and Mandy have a bidirectional interaction of weight 2.
* Alejandro, Miguel, and Topic\_Trigger only receive interactions.
* The interaction between Robert and Alejandro is stronger (weight 2) than other interactions involving Robert (weight 1).
* The interaction between Kenneth and Mandy is bidirectional and has a weight of 2 in both directions.
* The arrows indicate the direction of the interaction.
### Interpretation
The network diagram visualizes the relationships and interactions between different entities. The weights on the edges suggest the strength or frequency of these interactions. Robert's central position indicates a key role in the network, potentially acting as a hub or intermediary. The bidirectional interaction between Kenneth and Mandy suggests a close or reciprocal relationship. The diagram could represent communication patterns, influence networks, or any other type of interaction between entities. The "Topic\_Trigger" node receiving input from Robert suggests that Robert is initiating or influencing the topic.