\n
## Diagram: Relationship Network
### Overview
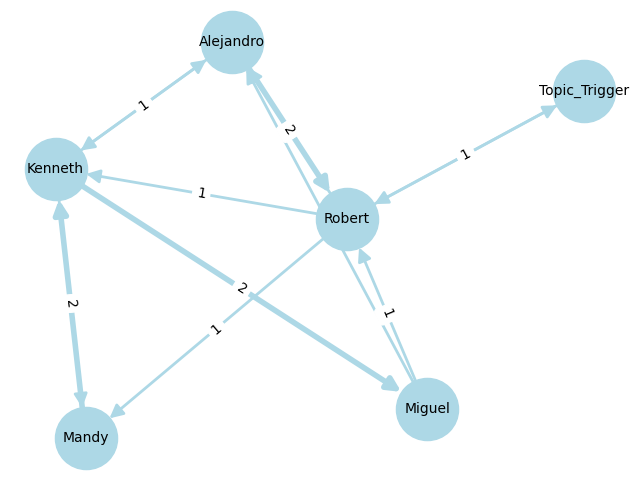
The image depicts a directed graph representing relationships between individuals and a topic trigger. Nodes represent people (Kenneth, Alejandro, Robert, Mandy, Miguel) and a topic ("Topic_Trigger"). Edges (arrows) indicate a relationship, with numerical labels representing the strength or frequency of that relationship.
### Components/Axes
The diagram consists of:
* **Nodes:** Kenneth, Alejandro, Robert, Mandy, Miguel, Topic_Trigger.
* **Edges:** Directed arrows connecting the nodes, labeled with numerical values (1 or 2).
* **No explicit axes or scales** are present, as this is a network diagram.
### Detailed Analysis or Content Details
The relationships are as follows:
* **Kenneth** has a directed edge to **Alejandro** with a value of 1.
* **Kenneth** has a directed edge to **Robert** with a value of 1.
* **Kenneth** has a directed edge to **Mandy** with a value of 2.
* **Alejandro** has a directed edge to **Robert** with a value of 2.
* **Robert** has a directed edge to **Topic_Trigger** with a value of 1.
* **Robert** has a directed edge to **Mandy** with a value of 2.
* **Robert** has a directed edge to **Miguel** with a value of 1.
* **Mandy** has a directed edge to **Miguel** with a value of 1.
* **Miguel** has a directed edge to **Robert** with a value of 1.
### Key Observations
* **Robert** is the most central node, receiving connections from Alejandro, Kenneth, and Miguel, and sending connections to Topic_Trigger, Mandy, and Miguel.
* The relationship between **Kenneth** and **Mandy** has a strength of 2, which is the highest value for connections originating from Kenneth.
* The relationship between **Alejandro** and **Robert** has a strength of 2.
* The relationship between **Robert** and **Mandy** has a strength of 2.
* All other relationships have a strength of 1.
### Interpretation
This diagram likely represents a network of influence or communication. The "Topic_Trigger" node suggests that the relationships are related to a specific topic. Robert appears to be a key influencer or intermediary, as many connections flow through him. The numerical values on the edges could represent the frequency of communication, the strength of influence, or the amount of information exchanged. The higher values (2) indicate stronger or more frequent relationships.
The diagram suggests a flow of information or influence from Kenneth and Alejandro to Robert, who then disseminates it to others (Mandy, Miguel, and the Topic_Trigger). Mandy and Miguel also have a direct relationship with each other. The network structure indicates a complex interplay of relationships, with Robert playing a central role in connecting different individuals and the topic. The diagram does not provide information about the *nature* of the relationships, only their existence and relative strength.