## Line Chart: Evolution of Step-by-step Construction Heuristics for TSP
### Overview
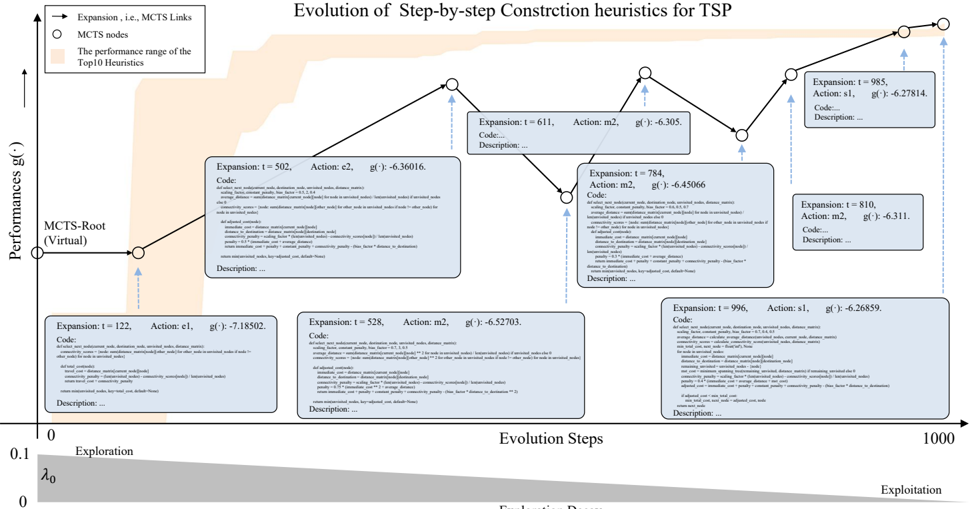
The image is a line chart illustrating the evolution of step-by-step construction heuristics for the Traveling Salesperson Problem (TSP). The chart plots the performance (g(-)) of a search algorithm over a series of evolution steps. The chart shows the performance of the MCTS-Root (Virtual) node and subsequent expansions, along with code snippets and descriptions associated with certain expansion steps. The background includes a shaded region representing the performance range of the top 10 heuristics.
### Components/Axes
* **Title:** Evolution of Step-by-step Construction heuristics for TSP
* **Y-axis:** Performances g(-)
* Label: Performances g(-)
* **X-axis:** Evolution Steps
* Label: Evolution Steps
* Scale: 0 to 1000
* **Legend:** Located in the top-left corner.
* Arrow: Expansion, i.e., MCTS Links
* Circle: MCTS nodes
* Shaded area: The performance range of the Top 10 Heuristics
* **Additional Elements:**
* MCTS-Root (Virtual) node at the origin.
* Boxes containing "Expansion: t=...", "Action:...", "g():...", "Code:...", and "Description:..." at various points along the line.
* A gradient bar at the bottom labeled "Exploration" on the left and "Exploitation" on the right, with "λ0" marked at approximately 0.1.
### Detailed Analysis
* **MCTS-Root (Virtual):**
* Starting point of the line chart, located at the origin (0,0).
* **Expansion Nodes:**
* Each node represents an expansion step in the algorithm.
* Each node is associated with an "Expansion: t=...", "Action:...", and "g():..." value.
* Each node also has a "Code:" and "Description:" section.
* **Line Segments:**
* The line segments connect the expansion nodes, showing the performance trend over time.
* **Performance Range of Top 10 Heuristics:**
* Represented by a shaded area in the background.
* Indicates the range of performance achieved by the top 10 heuristics for the TSP.
* **Exploration/Exploitation Gradient:**
* A gradient bar at the bottom indicates the transition from exploration to exploitation.
* "λ0" is marked at approximately 0.1, suggesting the point where the algorithm starts to shift from exploration to exploitation.
* **Specific Expansion Nodes and Values:**
* Expansion: t=122, Action: e1, g(): -7.18502.
* Expansion: t=502, Action: e2, g(): -6.36016.
* Expansion: t=528, Action: m2, g(): -6.52703.
* Expansion: t=611, Action: m2, g(): -6.305.
* Expansion: t=784, Action: m2, g(): -6.45066.
* Expansion: t=810, Action: m2, g(): -6.311.
* Expansion: t=985, Action: s1, g(): -6.27814.
* Expansion: t=996, Action: s1, g(): -6.26859.
* **Trend Analysis:**
* The performance (g(-)) generally increases (becomes less negative) as the number of evolution steps increases.
* There are some fluctuations in performance, with some steps resulting in a decrease in performance (more negative g(-)).
* The algorithm appears to be converging towards a better solution as it progresses.
### Key Observations
* The algorithm starts with a relatively poor performance (g(-) = -7.18502) and gradually improves over time.
* The performance fluctuates, indicating that some expansion steps are more effective than others.
* The algorithm seems to be exploiting better solutions towards the end of the evolution process, as indicated by the "Exploitation" region on the x-axis.
* The final performance (g(-) = -6.26859) is within the performance range of the top 10 heuristics, suggesting that the algorithm is competitive.
### Interpretation
The chart illustrates the performance of a step-by-step construction heuristic for the TSP. The algorithm starts with an initial solution and iteratively improves it through a series of expansion steps. The performance (g(-)) represents the quality of the solution at each step. The chart shows that the algorithm is able to find a relatively good solution within a reasonable number of steps. The fluctuations in performance suggest that the algorithm is exploring different parts of the solution space and sometimes makes suboptimal choices. However, overall, the algorithm is able to converge towards a better solution. The "Exploration/Exploitation" gradient suggests that the algorithm initially focuses on exploring different solutions and then gradually shifts towards exploiting the best solutions found so far. The fact that the final performance is within the range of the top 10 heuristics indicates that the algorithm is a viable approach for solving the TSP.