## Flowchart: Evolution of Step-by-step Construction heuristics for TSP
### Overview
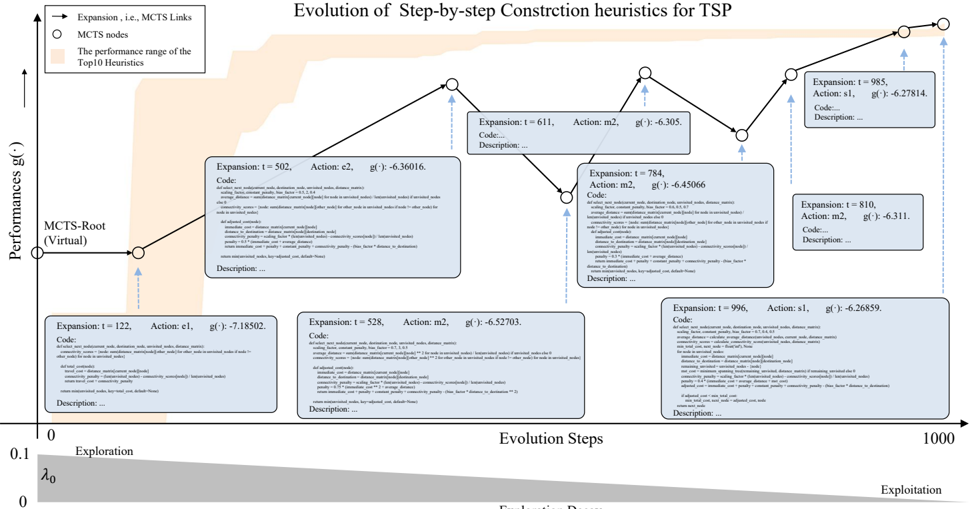
The diagram illustrates the evolution of heuristic construction for the Traveling Salesman Problem (TSP) through a series of expansion steps. It tracks performance metrics (g()) over time, showing the progression from an initial virtual root node (MCTS-Root) to optimized heuristics within a performance range shaded in peach. Arrows indicate the flow of evolution steps, with nodes containing detailed parameters like expansion time, actions, and performance scores.
### Components/Axes
- **X-axis**: "Evolution Steps" (0 to 1000, with key ticks at 122, 528, 611, 784, 810, 996, 1000).
- **Y-axis**: "Performances g(·)" (0 to 1, logarithmic scale).
- **Legend**:
- **MCTS-Root (Virtual)**: Circle symbol, starting point at (0, 0).
- **MCTS Links (Expansion)**: Square symbol, representing heuristic expansions.
- **Shaded Area**: Peach-colored region labeled "The performance range of the Top 10 Heuristics."
### Detailed Analysis
1. **Initial Node (MCTS-Root)**:
- Position: Bottom-left corner (0, 0).
- Label: "MCTS-Root (Virtual)".
- Description: Starting point with no expansions.
2. **Expansion Nodes**:
- **Expansion t=122, Action e1**:
- g(): -7.18502.
- Code/Description: Partial code snippet and truncated description.
- **Expansion t=528, Action m2**:
- g(): -6.52703.
- Code/Description: Partial code snippet and truncated description.
- **Expansion t=611, Action m2**:
- g(): -6.305.
- Code/Description: Partial code snippet and truncated description.
- **Expansion t=784, Action m2**:
- g(): -6.45966.
- Code/Description: Partial code snippet and truncated description.
- **Expansion t=810, Action m2**:
- g(): -6.311.
- Code/Description: Partial code snippet and truncated description.
- **Expansion t=996, Action s1**:
- g(): -6.26859.
- Code/Description: Partial code snippet and truncated description.
- **Final Node (t=1000)**:
- g(): 0.985 (highest performance).
- Action: a1.
- Code/Description: Partial code snippet and truncated description.
3. **Shaded Performance Range**:
- Covers the majority of the diagram’s upper region, indicating the performance bounds of the top 10 heuristics.
### Key Observations
- **Performance Trends**:
- g() values generally increase over time, with fluctuations (e.g., a dip at t=784).
- The final node at t=1000 achieves the highest g() (0.985), suggesting optimal heuristic construction.
- **Action Patterns**:
- Actions alternate between "e" (e.g., e1, e2) and "m" (e.g., m2, m1), with "s1" appearing late in the process.
- **Code/Description**:
- All nodes include truncated code snippets and descriptions, implying iterative refinement of heuristics.
### Interpretation
The diagram demonstrates how step-by-step heuristic construction for TSP evolves over 1000 steps. Starting from a virtual root (g()=0), each expansion (action) incrementally improves performance (g()), with the shaded area representing the range of the top 10 heuristics. The final node at t=1000 achieves near-optimal performance (g()=0.985), indicating that the process effectively balances exploration (early steps) and exploitation (later steps). The alternating actions (e/m/s) and code refinements suggest a systematic approach to optimizing TSP solutions, with the shaded region highlighting the competitive performance range of the best heuristics.