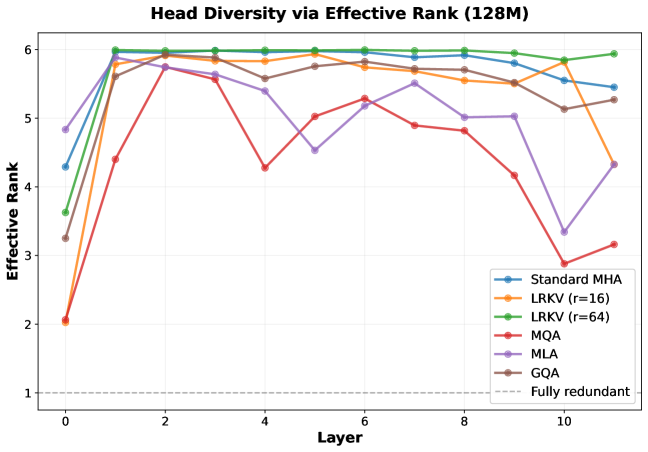
## Line Chart: Head Diversity via Effective Rank (128M)
### Overview
The chart visualizes the effective rank of different attention mechanisms across 11 layers (0–10) in a neural network model. Effective rank measures diversity, with lower values indicating higher redundancy. The y-axis ranges from 1 (fully redundant) to 6, while the x-axis represents layers. Six methods are compared: Standard MHA, LRKV (r=16), LRKV (r=64), MQA, MLA, and GQA.
### Components/Axes
- **X-axis (Layer)**: Discrete values from 0 to 10.
- **Y-axis (Effective Rank)**: Continuous scale from 1 (fully redundant) to 6.
- **Legend**: Located in the bottom-right corner, mapping colors to methods:
- Blue: Standard MHA
- Orange: LRKV (r=16)
- Green: LRKV (r=64)
- Red: MQA
- Purple: MLA
- Brown: GQA
- **Dashed Line**: Horizontal line at y=1 labeled "Fully redundant."
### Detailed Analysis
1. **Standard MHA (Blue)**:
- Starts at 4.2 (layer 0), peaks at 6.0 (layers 1–3), then declines to 5.5 (layer 10).
- Maintains high effective rank (5.5–6.0) across most layers.
2. **LRKV (r=16) (Orange)**:
- Begins at 2.0 (layer 0), rises sharply to 6.0 (layers 1–3), stabilizes at ~5.8 (layers 4–10).
- Shows the steepest initial increase.
3. **LRKV (r=64) (Green)**:
- Starts at 3.5 (layer 0), increases to 6.0 (layers 1–3), remains flat at 6.0 (layers 4–10).
- Highest effective rank for most layers.
4. **MQA (Red)**:
- Begins at 2.0 (layer 0), peaks at 6.0 (layers 1–3), then declines to 3.2 (layer 10).
- Most pronounced drop after layer 3.
5. **MLA (Purple)**:
- Starts at 4.8 (layer 0), fluctuates between 4.5–5.8 (layers 1–9), drops to 3.3 (layer 10).
- Sharp decline at layer 10.
6. **GQA (Brown)**:
- Begins at 3.2 (layer 0), rises to 5.8 (layers 1–3), stabilizes at ~5.5 (layers 4–10).
- Gradual increase followed by stabilization.
7. **Fully Redundant Line (Dashed)**:
- Horizontal line at y=1, never intersected by any method.
### Key Observations
- **No method reaches full redundancy** (y=1), indicating all maintain some diversity.
- **LRKV (r=64)** and **Standard MHA** consistently exhibit the highest effective ranks (5.5–6.0), suggesting lower diversity.
- **MQA** and **GQA** show significant variability, with MQA dropping sharply after layer 3.
- **MLA** has the most erratic trend, including a steep drop at layer 10.
- **LRKV (r=16)** and **GQA** demonstrate the most stable performance after initial increases.
### Interpretation
The chart highlights trade-offs between attention mechanisms in balancing diversity and redundancy. LRKV (r=64) and Standard MHA prioritize higher effective ranks (lower diversity), while MQA and MLA show greater variability, potentially indicating adaptive behavior. The absence of any method reaching full redundancy suggests all mechanisms retain some level of unique information propagation. The sharp drop in MLA at layer 10 may reflect architectural constraints or optimization challenges in later layers. These trends could inform decisions about method selection based on desired diversity profiles for specific tasks.