## Chart: Average Accuracy Delta Across All Games by Rating with Baseline Accuracy Curve
### Overview
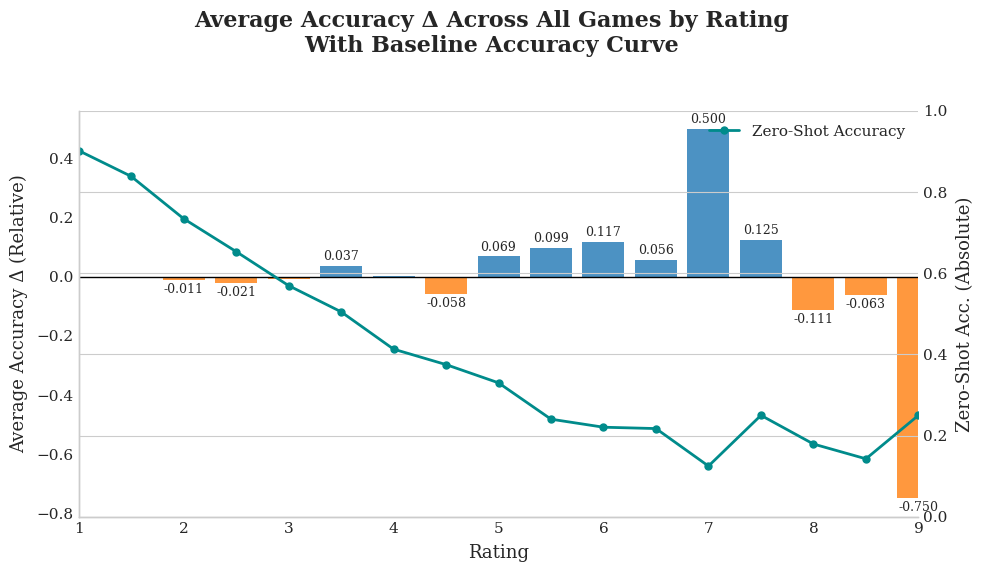
The image is a combination bar and line chart that displays the average accuracy delta (relative) and zero-shot accuracy (absolute) across all games by rating. The x-axis represents the rating, ranging from 1 to 9. The left y-axis represents the average accuracy delta (relative), ranging from -0.8 to 0.4. The right y-axis represents the zero-shot accuracy (absolute), ranging from 0.0 to 1.0. The chart includes a teal line representing the average accuracy delta and orange/blue bars representing the zero-shot accuracy.
### Components/Axes
* **Title:** Average Accuracy Δ Across All Games by Rating With Baseline Accuracy Curve
* **X-axis:** Rating (values from 1 to 9)
* **Left Y-axis:** Average Accuracy Δ (Relative) (values from -0.8 to 0.4, incrementing by 0.2)
* **Right Y-axis:** Zero-Shot Acc. (Absolute) (values from 0.0 to 1.0, incrementing by 0.2)
* **Legend:** Located at the top-right of the chart.
* Teal Line: Zero-Shot Accuracy
* **Data Series:**
* Teal Line: Average Accuracy Delta
* Orange/Blue Bars: Zero-Shot Accuracy
### Detailed Analysis
**1. Average Accuracy Delta (Teal Line):**
* **Trend:** The line generally slopes downward as the rating increases.
* **Data Points:**
* Rating 1: Approximately 0.41
* Rating 2: Approximately 0.20
* Rating 3: Approximately -0.04
* Rating 4: Approximately -0.21
* Rating 5: Approximately -0.30
* Rating 6: Approximately -0.50
* Rating 7: Approximately -0.52
* Rating 8: Approximately -0.45
* Rating 9: Approximately -0.65
**2. Zero-Shot Accuracy (Orange/Blue Bars):**
* **Trend:** The bars fluctuate, with a significant spike at rating 7 and a large negative value at rating 9.
* **Data Points:**
* Rating 1: -0.011 (Orange)
* Rating 2: -0.021 (Orange)
* Rating 3: 0.037 (Blue)
* Rating 4: -0.058 (Orange)
* Rating 5: 0.069 (Blue)
* Rating 6: 0.117 (Blue)
* Rating 7: 0.500 (Blue)
* Rating 8: 0.125 (Blue)
* Rating 9: -0.750 (Orange)
### Key Observations
* The average accuracy delta generally decreases as the rating increases.
* The zero-shot accuracy has a significant positive spike at rating 7 and a large negative value at rating 9.
* The zero-shot accuracy is mostly positive between ratings 3 and 8.
### Interpretation
The chart suggests that as the game rating increases, the average accuracy delta tends to decrease, indicating that higher-rated games are more challenging or that players perform relatively worse compared to their expected performance. The zero-shot accuracy fluctuates, with a notable peak at rating 7, suggesting that the model performs particularly well on games with this rating without any prior training. The large negative value at rating 9 indicates a significant drop in zero-shot accuracy for the highest-rated games, which could be due to increased complexity or different game mechanics. The relationship between the average accuracy delta and zero-shot accuracy is not immediately clear and may require further analysis to understand the underlying factors influencing these metrics.