## Chart: Average Accuracy Δ Across All Games by Rating With Baseline Accuracy Curve
### Overview
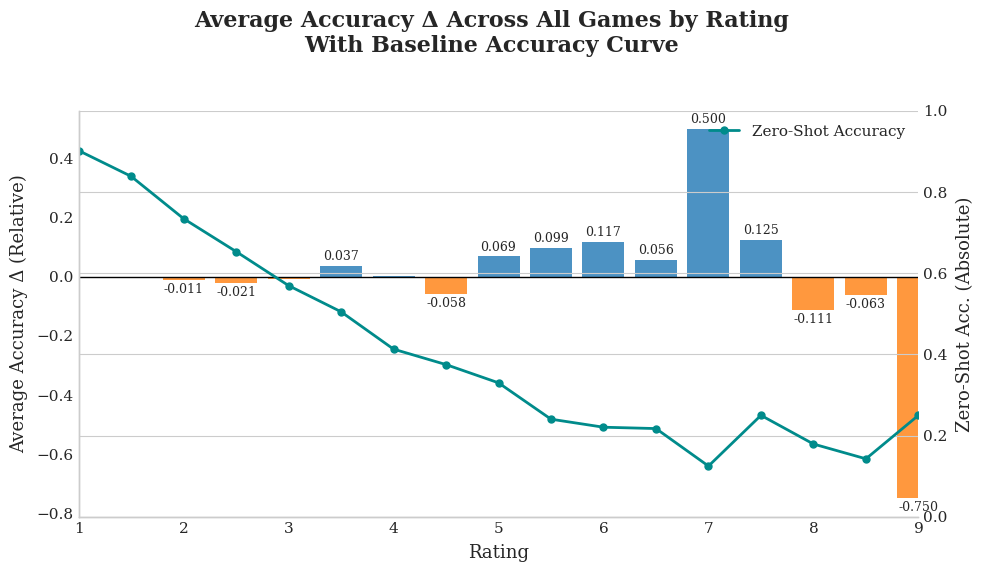
This chart displays the change in average accuracy (Δ) across all games, categorized by rating, alongside a baseline accuracy curve. The chart uses a dual y-axis to represent both relative accuracy change and absolute zero-shot accuracy. The x-axis represents the rating, ranging from 1 to 9.
### Components/Axes
* **Title:** Average Accuracy Δ Across All Games by Rating With Baseline Accuracy Curve
* **X-axis:** Rating (Scale: 1 to 9)
* **Left Y-axis:** Average Accuracy Δ (Relative) (Scale: -0.8 to 0.4)
* **Right Y-axis:** Zero-Shot Acc. (Absolute) (Scale: 0.0 to 1.0)
* **Data Series 1:** Baseline Accuracy Curve (Teal Line)
* **Data Series 2:** Accuracy Change Bars (Blue Bars)
* **Legend:** Zero-Shot Accuracy (placed in the top-right corner)
### Detailed Analysis
The chart consists of a line graph representing the baseline accuracy and a series of blue bars representing the average accuracy change (Δ) for each rating.
**Baseline Accuracy Curve (Teal Line):**
The teal line shows a decreasing trend.
* Rating 1: Approximately 0.35
* Rating 2: Approximately 0.24
* Rating 3: Approximately 0.14
* Rating 4: Approximately 0.05
* Rating 5: Approximately -0.15
* Rating 6: Approximately -0.25
* Rating 7: Approximately -0.35
* Rating 8: Approximately -0.45
* Rating 9: Approximately -0.75
**Accuracy Change Bars (Blue Bars):**
The blue bars represent the change in accuracy for each rating. Values are displayed above each bar.
* Rating 1: -0.011
* Rating 2: -0.021
* Rating 3: 0.037
* Rating 4: -0.058
* Rating 5: 0.069
* Rating 6: 0.099
* Rating 7: 0.117
* Rating 8: 0.056
* Rating 9: 0.125
* Rating 7: 0.500 (Zero-Shot Accuracy)
* Rating 8: -0.111
* Rating 9: -0.063
**Zero-Shot Accuracy (Orange Line):**
The orange line shows the zero-shot accuracy.
* Rating 1: Approximately 0.8
* Rating 2: Approximately 0.6
* Rating 3: Approximately 0.4
* Rating 4: Approximately 0.2
* Rating 5: Approximately 0.0
* Rating 6: Approximately 0.2
* Rating 7: Approximately 0.4
* Rating 8: Approximately 0.6
* Rating 9: Approximately 0.8
### Key Observations
* The baseline accuracy consistently decreases as the rating increases.
* The accuracy change (Δ) fluctuates, with positive changes at ratings 3, 5, 6, and 7, and negative changes at ratings 1, 2, 4, 8, and 9.
* Rating 7 shows a significant peak in accuracy change (0.500 for Zero-Shot Accuracy).
* The zero-shot accuracy is highest at rating 1 and decreases to a minimum around rating 5 before increasing again.
### Interpretation
The chart suggests that as the rating increases, the baseline accuracy of the model decreases. However, the accuracy change (Δ) indicates that the model can sometimes improve its performance at specific rating levels. The peak at rating 7 suggests that there might be a particular characteristic of games at that rating that the model handles exceptionally well. The zero-shot accuracy provides a baseline performance metric, showing how well the model performs without any prior training on the specific game. The fluctuations in accuracy change could be due to the complexity or characteristics of games at different rating levels. The negative accuracy change at ratings 8 and 9 suggests that the model struggles with higher-rated games. The relationship between the baseline accuracy and the accuracy change is complex, indicating that simply improving the baseline accuracy might not be sufficient to improve performance across all rating levels. Further investigation is needed to understand the factors that contribute to the observed patterns.