\n
## Dual-Axis Chart: Average Accuracy Δ Across All Games by Rating With Baseline Accuracy Curve
### Overview
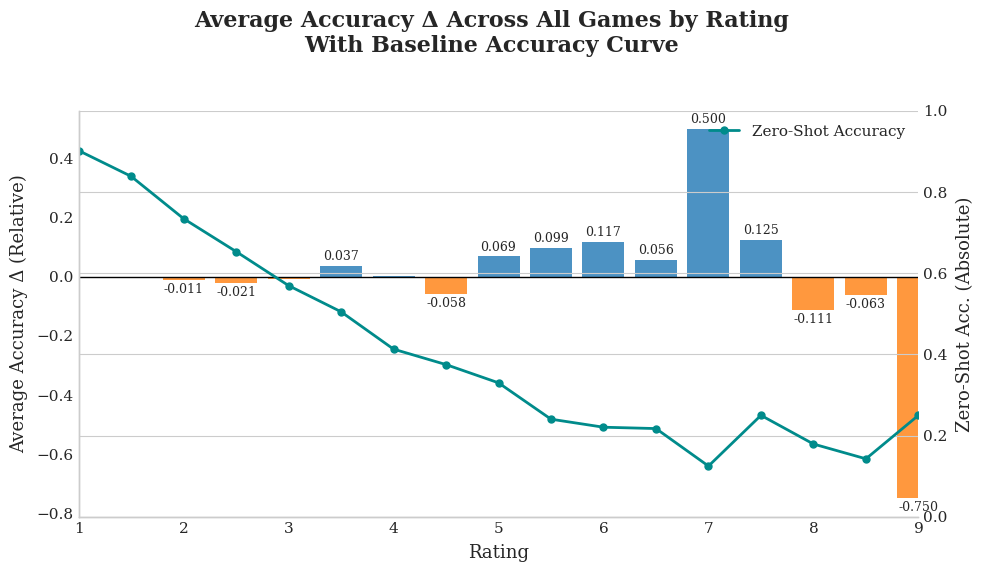
This is a dual-axis chart combining a bar chart and a line chart. It visualizes the relationship between game "Rating" (x-axis) and two performance metrics: the relative change in average accuracy (Average Accuracy Δ, bars) and the absolute zero-shot accuracy (Zero-Shot Accuracy, line). The chart suggests an analysis of how model performance varies with game ratings.
### Components/Axes
* **Title:** "Average Accuracy Δ Across All Games by Rating With Baseline Accuracy Curve"
* **X-Axis:** Labeled "Rating". It has discrete integer markers from 1 to 9.
* **Left Y-Axis (Primary):** Labeled "Average Accuracy Δ (Relative)". Scale ranges from -0.8 to 0.4, with grid lines at intervals of 0.2. This axis corresponds to the bar chart.
* **Right Y-Axis (Secondary):** Labeled "Zero-Shot Acc. (Absolute)". Scale ranges from 0.0 to 1.0, with grid lines at intervals of 0.2. This axis corresponds to the line chart.
* **Legend:** Located in the top-right corner of the plot area. It contains a single entry: a teal line with a circle marker labeled "Zero-Shot Accuracy".
* **Data Series 1 (Bars):** Represents "Average Accuracy Δ". Bars are colored blue for positive values and orange for negative values. Each bar has a numerical label indicating its exact value.
* **Data Series 2 (Line):** A teal line with circular data points representing "Zero-Shot Accuracy". Its values are read from the right y-axis.
### Detailed Analysis
**Bar Chart Data (Average Accuracy Δ, Left Axis):**
The values for each rating are explicitly labeled on the bars.
* Rating 1: +0.037 (Blue bar)
* Rating 2: -0.011 (Orange bar)
* Rating 3: -0.021 (Orange bar)
* Rating 4: -0.058 (Orange bar)
* Rating 5: +0.069 (Blue bar)
* Rating 6: +0.099 (Blue bar)
* Rating 7: +0.117 (Blue bar)
* Rating 8: +0.056 (Blue bar)
* Rating 9: +0.125 (Blue bar)
* **Anomaly/Outlier:** There is a very large, unlabeled orange bar at the far right, positioned between Rating 8 and 9. Its value is labeled as **-0.750**. This is a significant negative outlier.
**Line Chart Data (Zero-Shot Accuracy, Right Axis):**
The line shows a general downward trend with some fluctuations. Approximate values are estimated from the grid lines.
* Rating 1: ~0.92
* Rating 2: ~0.85
* Rating 3: ~0.78
* Rating 4: ~0.70
* Rating 5: ~0.65
* Rating 6: ~0.60
* Rating 7: ~0.55 (Local minimum)
* Rating 8: ~0.62 (Local peak)
* Rating 9: ~0.58
### Key Observations
1. **Inverse Relationship Trend:** There is a general inverse relationship between the two metrics. As the "Rating" increases from 1 to 7, the Zero-Shot Accuracy (line) consistently decreases, while the Average Accuracy Δ (bars) shows a mixed but generally improving trend from negative to positive values.
2. **Performance Peak at Mid-High Ratings:** The highest positive Average Accuracy Δ occurs at Rating 7 (+0.117) and Rating 9 (+0.125). The Zero-Shot Accuracy hits its lowest point at Rating 7 (~0.55).
3. **Significant Negative Outlier:** The bar labeled **-0.750** is a dramatic outlier, indicating a severe drop in average accuracy for a specific subset of data associated with the high-rating end of the scale. Its placement between ratings 8 and 9 is ambiguous.
4. **Volatility at High Ratings:** Performance metrics become more volatile at higher ratings (7-9), with large swings in both the positive Δ and the extreme negative outlier.
### Interpretation
The data suggests that the model's baseline (zero-shot) performance degrades as game ratings increase, indicating that higher-rated games are inherently more challenging for the model in a zero-shot setting.
However, the "Average Accuracy Δ" likely measures performance *relative to a baseline* (perhaps a fine-tuned model or a different prompting strategy). The positive Δ values for ratings 5-9 (excluding the outlier) show that this alternative method *improves* upon the zero-shot baseline, especially for mid-to-high rated games. The improvement is most pronounced at ratings 7 and 9.
The critical outlier of **-0.750** is the most important finding. It represents a catastrophic failure case where the alternative method performs drastically worse than the baseline for a specific segment of high-rated games. This anomaly warrants immediate investigation—it could indicate a subset of games with unique characteristics that break the model, a data processing error, or a fundamental limitation of the approach being tested.
In summary, the chart tells a story of a model that struggles with high-rated games out-of-the-box, an intervention that generally helps but has a severe, localized failure mode. The focus for improvement should be on understanding and mitigating the cause of the -0.750 accuracy drop.