## Bar Chart: Speedup Comparison Across Datasets and Methods
### Overview
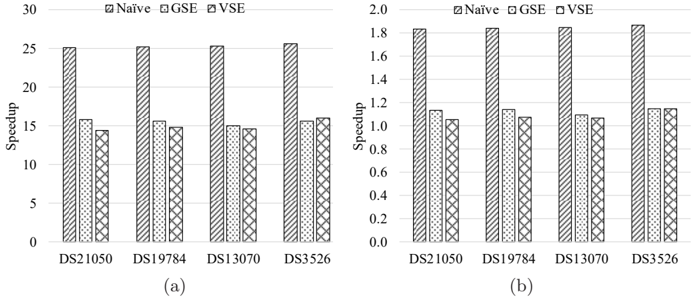
The image contains two side-by-side bar charts (subplots a and b) comparing speedup values for four datasets (DS21050, DS19784, DS13070, DS3526) across three computational methods: Naïve, GSE, and VSE. The charts use grayscale patterns (striped, dotted, crosshatched) to differentiate methods. Subplot (a) shows absolute speedup values (0–30), while subplot (b) shows normalized speedup (0–2.0).
### Components/Axes
- **X-axis**: Datasets (DS21050, DS19784, DS13070, DS3526), labeled sequentially from left to right.
- **Y-axis (a)**: Speedup (0–30), with gridlines at 5-unit intervals.
- **Y-axis (b)**: Speedup (0–2.0), with gridlines at 0.2-unit intervals.
- **Legend**: Positioned at the top of each subplot, with labels:
- Naïve (striped pattern)
- GSE (dotted pattern)
- VSE (crosshatched pattern)
- **Subplot Titles**: None explicitly labeled, but subplot (a) has higher magnitude values than (b).
### Detailed Analysis
#### Subplot (a) (Absolute Speedup)
- **DS21050**:
- Naïve: ~25
- GSE: ~15
- VSE: ~14
- **DS19784**:
- Naïve: ~25
- GSE: ~15
- VSE: ~14
- **DS13070**:
- Naïve: ~25
- GSE: ~15
- VSE: ~14
- **DS3526**:
- Naïve: ~25
- GSE: ~15
- VSE: ~16
#### Subplot (b) (Normalized Speedup)
- **DS21050**:
- Naïve: ~1.8
- GSE: ~1.1
- VSE: ~1.0
- **DS19784**:
- Naïve: ~1.8
- GSE: ~1.1
- VSE: ~1.0
- **DS13070**:
- Naïve: ~1.8
- GSE: ~1.1
- VSE: ~1.0
- **DS3526**:
- Naïve: ~1.8
- GSE: ~1.1
- VSE: ~1.1
### Key Observations
1. **Method Consistency**: Naïve consistently shows the highest speedup in both subplots, followed by GSE and VSE.
2. **Dataset Variance**: All datasets exhibit similar trends, with no significant outliers between datasets.
3. **Normalization Impact**: Subplot (b) values are ~1/20th of subplot (a), suggesting normalization or unit conversion between subplots.
4. **Pattern Accuracy**: Legend patterns (striped/dotted/crosshatched) align perfectly with bar styles in both subplots.
### Interpretation
The data suggests that the Naïve method achieves the highest speedup across all datasets, while GSE and VSE perform comparably but with lower efficiency. The near-identical trends across datasets imply that method performance is independent of dataset characteristics. The drastic reduction in subplot (b) values (vs. subplot (a)) indicates a potential normalization factor (e.g., baseline speedup subtracted) or a unit conversion (e.g., from absolute to relative speedup). The slight advantage of VSE over GSE in DS3526 (subplot a) may reflect dataset-specific optimizations, but the small difference (~1 unit) suggests minimal practical impact. This analysis highlights the Naïve method as the most efficient choice in this context, though further investigation into the normalization methodology is warranted.