## Bar Charts: Speedup Comparison
### Overview
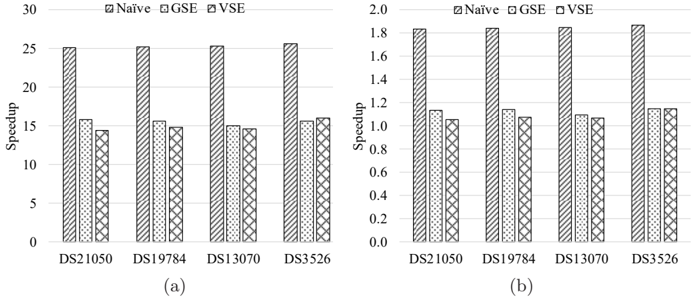
The image contains two bar charts comparing the speedup achieved by three different methods (Naive, GSE, and VSE) across four datasets (DS21050, DS19784, DS13070, and DS3526). Chart (a) shows speedup values ranging from 0 to 30, while chart (b) shows speedup values ranging from 0.0 to 2.0.
### Components/Axes
**Chart (a):**
* **Title:** None explicitly provided.
* **X-axis:** Datasets: DS21050, DS19784, DS13070, DS3526
* **Y-axis:** Speedup, ranging from 0 to 30 in increments of 5.
* **Legend:** Located at the top of the chart.
* Naïve: Bar with diagonal lines from top-left to bottom-right.
* GSE: Plain bar.
* VSE: Bar with a cross-hatch pattern.
**Chart (b):**
* **Title:** None explicitly provided.
* **X-axis:** Datasets: DS21050, DS19784, DS13070, DS3526
* **Y-axis:** Speedup, ranging from 0.0 to 2.0 in increments of 0.2.
* **Legend:** Located at the top of the chart.
* Naïve: Bar with diagonal lines from top-left to bottom-right.
* GSE: Plain bar.
* VSE: Bar with a cross-hatch pattern.
### Detailed Analysis
**Chart (a): Speedup (0-30)**
* **DS21050:**
* Naïve: ~25
* GSE: ~16
* VSE: ~14
* **DS19784:**
* Naïve: ~25
* GSE: ~16
* VSE: ~15
* **DS13070:**
* Naïve: ~25
* GSE: ~16
* VSE: ~15
* **DS3526:**
* Naïve: ~26
* GSE: ~16
* VSE: ~15
**Chart (b): Speedup (0.0-2.0)**
* **DS21050:**
* Naïve: ~1.8
* GSE: ~1.1
* VSE: ~1.0
* **DS19784:**
* Naïve: ~1.8
* GSE: ~1.2
* VSE: ~1.1
* **DS13070:**
* Naïve: ~1.8
* GSE: ~1.1
* VSE: ~1.1
* **DS3526:**
* Naïve: ~1.9
* GSE: ~1.2
* VSE: ~1.1
### Key Observations
* In both charts, the "Naïve" method consistently achieves the highest speedup across all datasets.
* The "GSE" method generally performs better than the "VSE" method.
* The relative performance of the methods is consistent across the datasets.
* Chart (a) shows a much larger range of speedup values than chart (b).
### Interpretation
The charts demonstrate a comparison of speedup achieved by different methods on various datasets. The "Naïve" method consistently outperforms "GSE" and "VSE," suggesting it is the most efficient approach for these datasets. The difference in scale between chart (a) and chart (b) suggests that the speedup values are being measured or calculated differently, possibly representing different aspects of performance. The consistency of the relative performance across datasets indicates that the methods' effectiveness is not highly dependent on the specific dataset being used.