## Scatter Plot Grid: Fraction of Variance in Centered and Averaged Activations Explained by PCs
### Overview
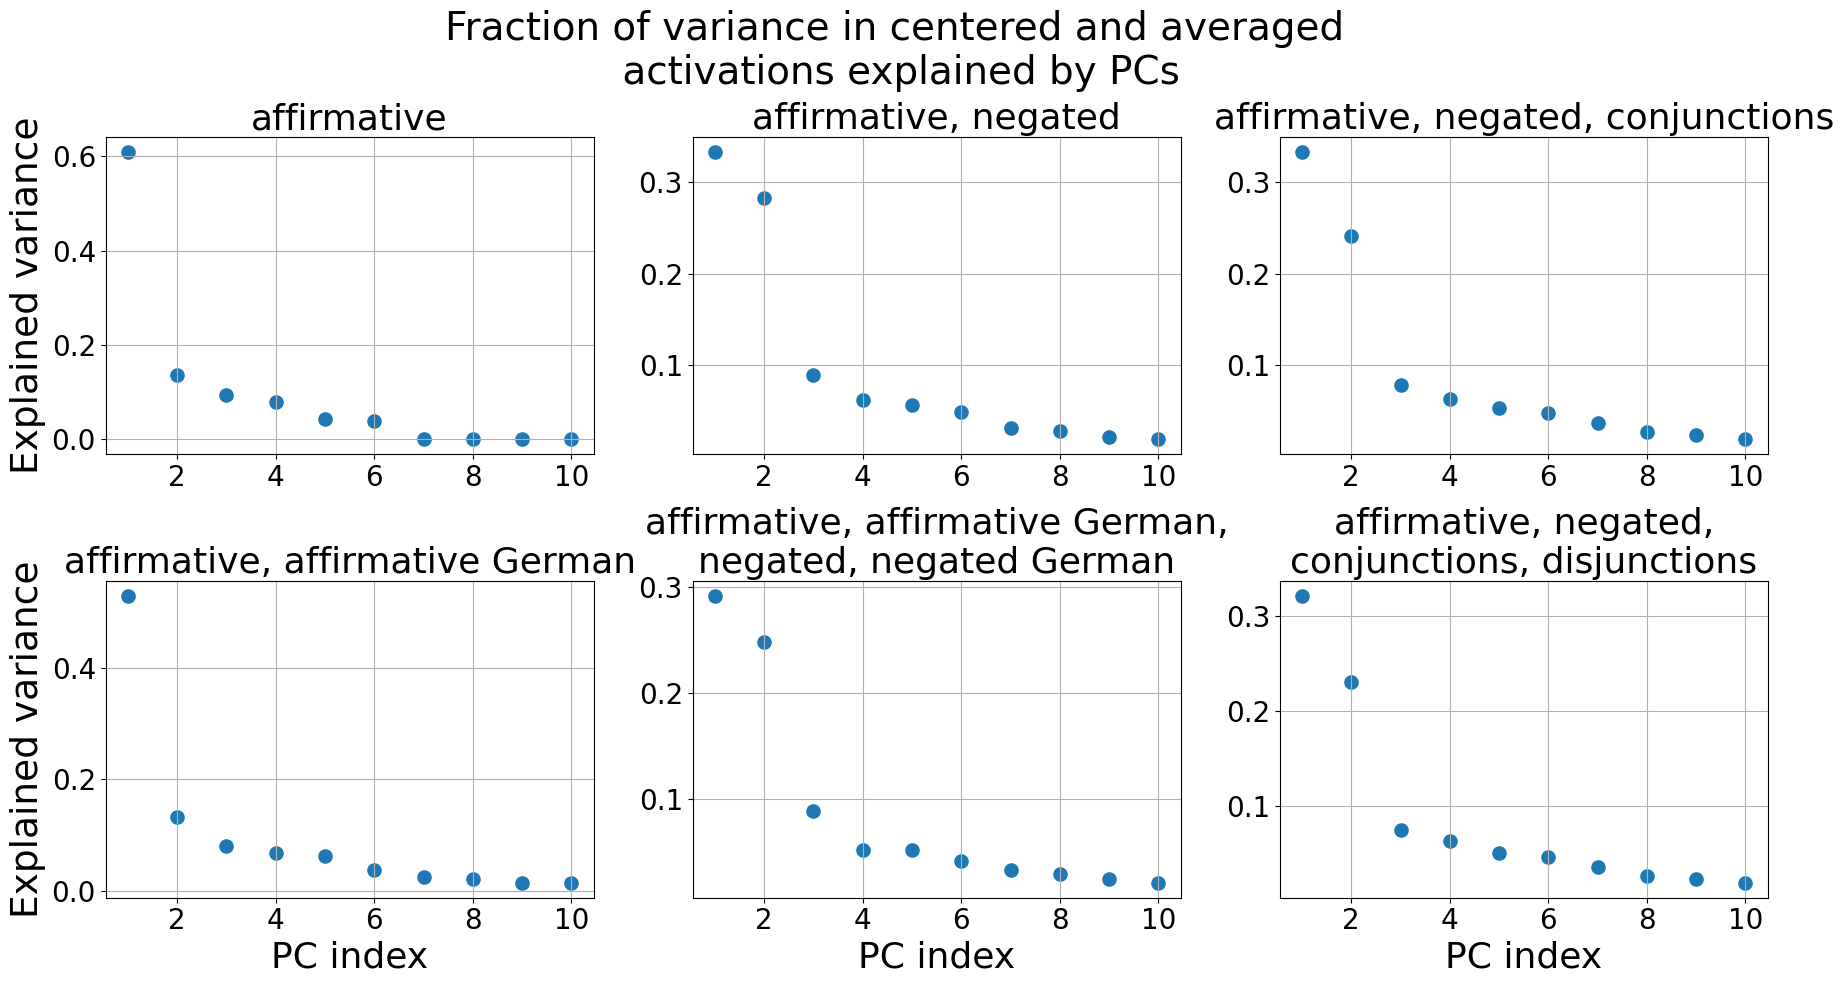
The image displays a 2x3 grid of scatter plots comparing the relationship between principal component (PC) index and explained variance across six linguistic feature configurations. Each plot uses blue data points to show how variance decreases with increasing PC index, with distinct configurations labeled in the plot titles.
### Components/Axes
- **Main Title**: "Fraction of variance in centered and averaged activations explained by PCs" (top center)
- **X-axis**: "PC index" (1–10) across all plots
- **Y-axis**: "Explained variance" (0–0.6) across all plots
- **Subplot Titles** (top of each plot):
1. Top-left: "affirmative"
2. Top-middle: "affirmative, negated"
3. Top-right: "affirmative, negated, conjunctions"
4. Bottom-left: "affirmative, affirmative German"
5. Bottom-middle: "affirmative, affirmative German, negated, negated German"
6. Bottom-right: "affirmative, negated, conjunctions, disjunctions"
- **No explicit legend** present
### Detailed Analysis
1. **Affirmative (Top-left)**:
- Highest initial variance (~0.6 at PC 1)
- Sharp decline to near-zero by PC 10
- Data points: (1, 0.6), (2, 0.15), (3–10, <0.05)
2. **Affirmative, Negated (Top-middle)**:
- Initial variance ~0.3 at PC 1
- Gradual decline to ~0.05 by PC 10
- Data points: (1, 0.3), (2, 0.08), (3–10, <0.05)
3. **Affirmative, Negated, Conjunctions (Top-right)**:
- Initial variance ~0.3 at PC 1
- Steeper decline than top-middle, reaching ~0.03 by PC 10
- Data points: (1, 0.3), (2, 0.06), (3–10, <0.03)
4. **Affirmative, Affirmative German (Bottom-left)**:
- Initial variance ~0.45 at PC 1
- Moderate decline to ~0.03 by PC 10
- Data points: (1, 0.45), (2, 0.1), (3–10, <0.03)
5. **Affirmative, Affirmative German, Negated, Negated German (Bottom-middle)**:
- Initial variance ~0.3 at PC 1
- Gradual decline to ~0.02 by PC 10
- Data points: (1, 0.3), (2, 0.07), (3–10, <0.02)
6. **Affirmative, Negated, Conjunctions, Disjunctions (Bottom-right)**:
- Initial variance ~0.3 at PC 1
- Steeper decline than top-right, reaching ~0.02 by PC 10
- Data points: (1, 0.3), (2, 0.05), (3–10, <0.02)
### Key Observations
- All configurations show **monotonic decrease** in explained variance with increasing PC index
- **First PC** consistently explains the largest variance (0.3–0.6 range)
- **German-specific configurations** (bottom row) show slightly lower initial variance than English-only configurations
- **Complex configurations** (e.g., conjunctions/disjunctions) exhibit faster variance decay
- No plot shows variance exceeding 0.6 or falling below 0.0
### Interpretation
The data demonstrates classic principal component analysis (PCA) behavior, where early components capture dominant patterns. The linguistic feature configurations suggest:
1. **Core semantics** (affirmative/negated) explain the largest variance
2. **Syntactic features** (conjunctions/disjunctions) add diminishing explanatory power
3. **Language-specific variants** (German) reduce overall variance explained
4. The consistent decay pattern across all plots implies a shared dimensional structure in the activation data, with linguistic features modulating the strength of early components. The absence of variance beyond PC 10 suggests the dataset may be well-represented by the first 10 principal components.