## Scatter Plot Grid: Fraction of Variance Explained by PCs
### Overview
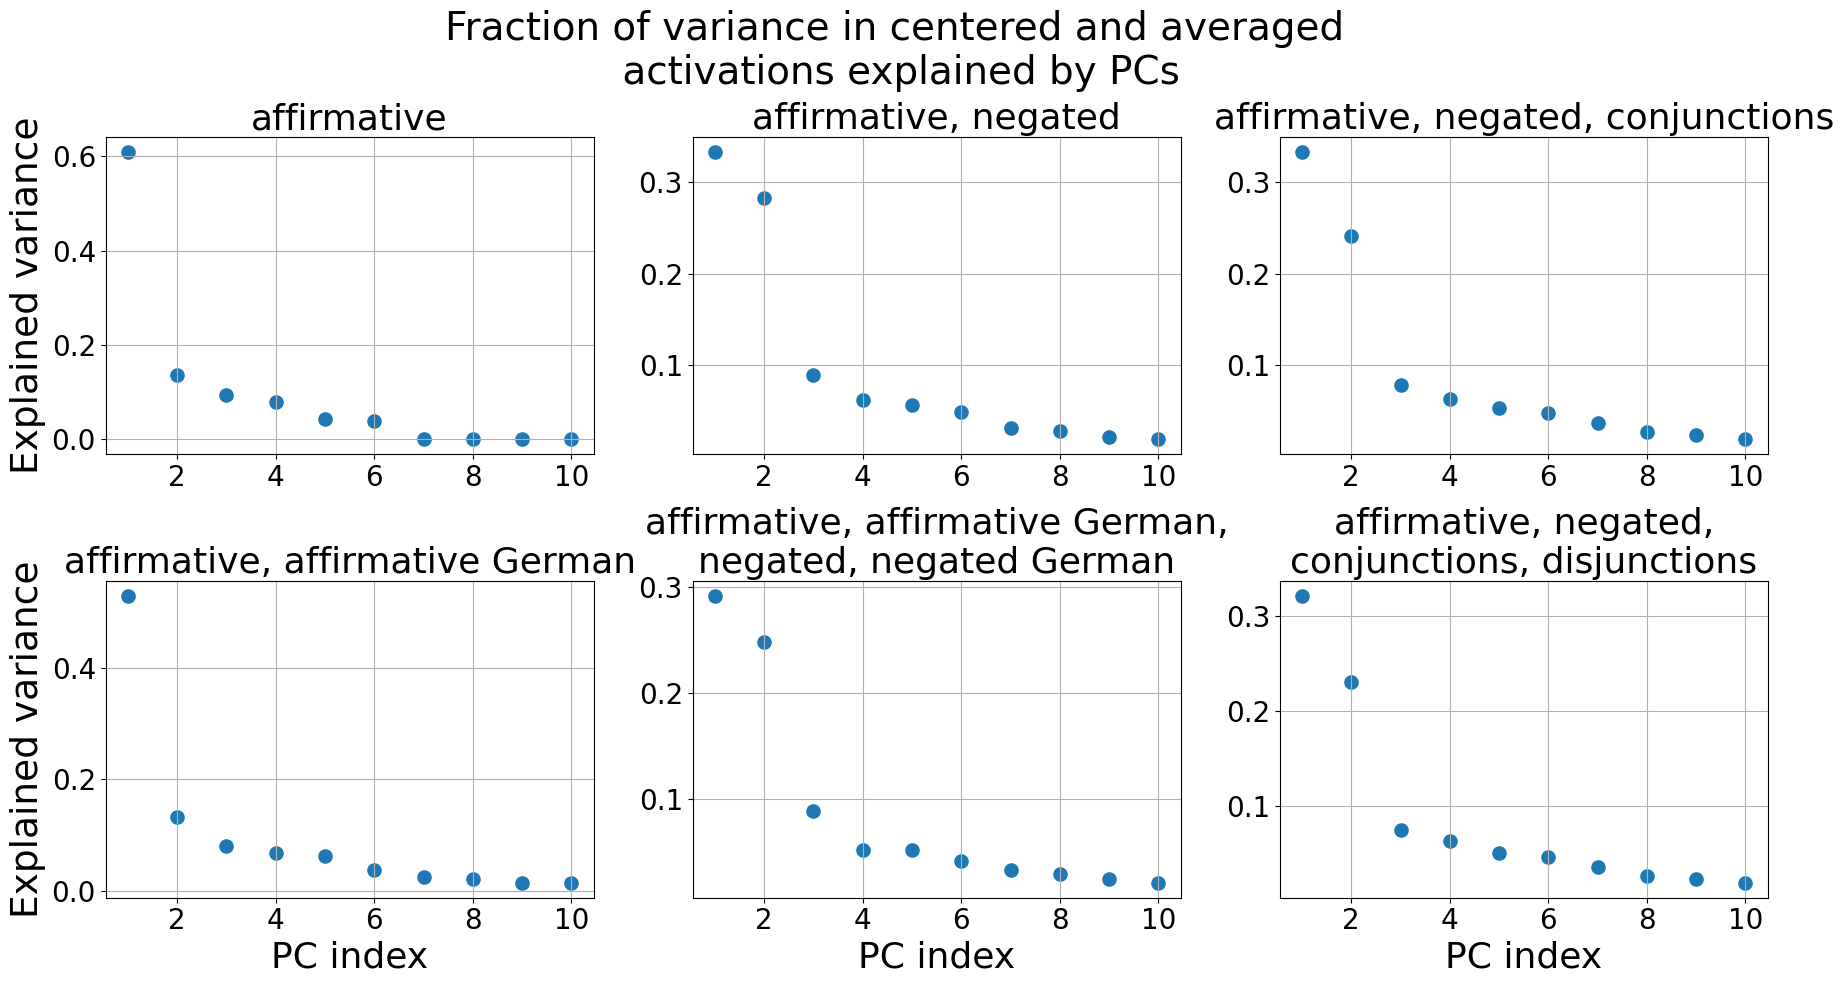
The image presents a grid of six scatter plots. Each plot shows the fraction of variance explained by principal components (PCs) for different combinations of affirmative, negated, German, conjunction, and disjunction sentence types. The x-axis represents the PC index (from 1 to 10), and the y-axis represents the explained variance (from 0 to approximately 0.6). All plots show a decreasing trend, indicating that the first few PCs explain most of the variance.
### Components/Axes
* **Title:** Fraction of variance in centered and averaged activations explained by PCs
* **X-axis (all plots):** PC index, with ticks at 2, 4, 6, 8, and 10.
* **Y-axis (left plots):** Explained variance, with ticks at 0.0, 0.2, 0.4, and 0.6.
* **Y-axis (right and center plots):** Explained variance, with ticks at 0.1, 0.2, and 0.3.
* **Plot Titles (from top-left to bottom-right):**
* affirmative
* affirmative, negated
* affirmative, negated, conjunctions
* affirmative, affirmative German
* affirmative, affirmative German, negated, negated German
* affirmative, negated, conjunctions, disjunctions
### Detailed Analysis
**Plot 1: affirmative**
* Trend: Decreasing. The explained variance drops sharply from PC 1 to PC 2, then decreases more gradually.
* PC 1: Approximately 0.61
* PC 2: Approximately 0.14
* PC 10: Approximately 0.01
**Plot 2: affirmative, negated**
* Trend: Decreasing. Similar to Plot 1, with a sharp initial drop.
* PC 1: Approximately 0.29
* PC 2: Approximately 0.09
* PC 10: Approximately 0.02
**Plot 3: affirmative, negated, conjunctions**
* Trend: Decreasing. Again, a sharp initial drop.
* PC 1: Approximately 0.32
* PC 2: Approximately 0.24
* PC 10: Approximately 0.02
**Plot 4: affirmative, affirmative German**
* Trend: Decreasing.
* PC 1: Approximately 0.50
* PC 2: Approximately 0.13
* PC 10: Approximately 0.01
**Plot 5: affirmative, affirmative German, negated, negated German**
* Trend: Decreasing.
* PC 1: Approximately 0.29
* PC 2: Approximately 0.17
* PC 10: Approximately 0.01
**Plot 6: affirmative, negated, conjunctions, disjunctions**
* Trend: Decreasing.
* PC 1: Approximately 0.32
* PC 2: Approximately 0.23
* PC 10: Approximately 0.01
### Key Observations
* In all plots, the first principal component explains the largest fraction of variance.
* The explained variance decreases rapidly for the first few PCs and then levels off.
* The "affirmative" plot has the highest initial explained variance (PC 1 ≈ 0.61), while the other plots have lower initial values (around 0.3 to 0.5).
* The explained variance for PC 10 is consistently low (around 0.01-0.02) across all plots.
### Interpretation
The plots demonstrate that a small number of principal components can capture a significant portion of the variance in the centered and averaged activations. This suggests that the underlying data has a relatively low intrinsic dimensionality. The "affirmative" condition seems to have a more dominant first principal component compared to the other conditions, which include negations, conjunctions, and disjunctions. This could indicate that affirmative sentences have a more consistent activation pattern across the dataset. The addition of German sentences and their negations does not drastically alter the overall trend, suggesting that the principal components are capturing more general linguistic features rather than language-specific ones. The consistent low variance explained by higher-order PCs (e.g., PC 10) indicates that these components capture noise or less important variations in the data.