## Scatter Plots: Fraction of Variance Explained by PCs
### Overview
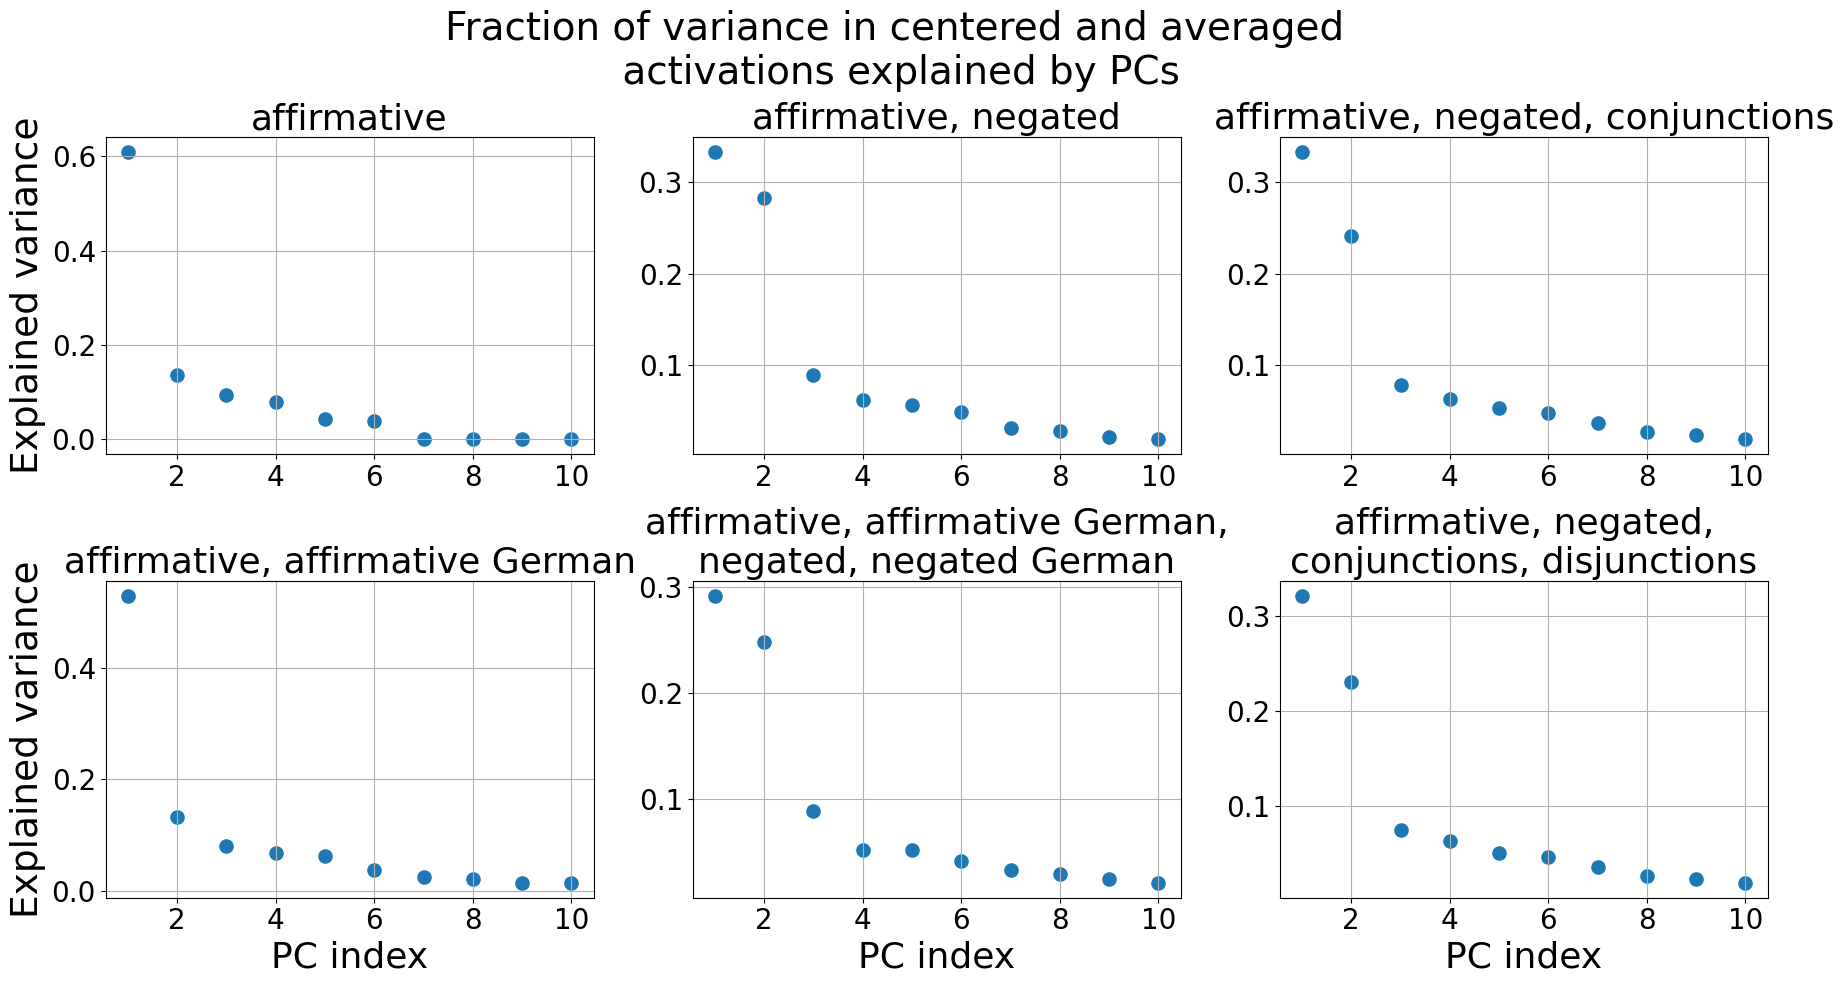
The image presents six scatter plots, each visualizing the fraction of variance in centered and averaged activations explained by Principal Components (PCs). Each plot corresponds to a different linguistic condition. The x-axis represents the PC index (ranging from 1 to 10), and the y-axis represents the explained variance (ranging from 0 to approximately 0.6).
### Components/Axes
* **Title:** "Fraction of variance in centered and averaged activations explained by PCs" (centered at the top)
* **X-axis Label:** "PC index" (present on all plots)
* **Y-axis Label:** "Explained variance" (present on all plots)
* **Plots (from top-left to bottom-right):**
1. "affirmative"
2. "affirmative, negated"
3. "affirmative, negated, conjunctions"
4. "affirmative, affirmative German"
5. "affirmative, affirmative German, negated, negated German"
6. "affirmative, negated, conjunctions, disjunctions"
### Detailed Analysis
Each plot shows a distribution of explained variance across the first 10 PCs. The plots share the same x and y axis scales.
**Plot 1: "affirmative"**
* Trend: The explained variance starts high at PC index 1 and rapidly decreases, then plateaus around 0.05-0.1 for PC indices 3-10.
* Data Points (approximate):
* PC 1: 0.62
* PC 2: 0.12
* PC 3: 0.07
* PC 4: 0.06
* PC 5: 0.05
* PC 6: 0.04
* PC 7: 0.03
* PC 8: 0.03
* PC 9: 0.03
* PC 10: 0.03
**Plot 2: "affirmative, negated"**
* Trend: Similar to the first plot, but with lower overall explained variance. Starts around 0.3 and decreases rapidly, plateauing around 0.05-0.1.
* Data Points (approximate):
* PC 1: 0.31
* PC 2: 0.14
* PC 3: 0.08
* PC 4: 0.06
* PC 5: 0.05
* PC 6: 0.04
* PC 7: 0.04
* PC 8: 0.04
* PC 9: 0.04
* PC 10: 0.04
**Plot 3: "affirmative, negated, conjunctions"**
* Trend: Similar to the previous plots, with a slightly lower initial variance.
* Data Points (approximate):
* PC 1: 0.28
* PC 2: 0.12
* PC 3: 0.07
* PC 4: 0.06
* PC 5: 0.05
* PC 6: 0.04
* PC 7: 0.04
* PC 8: 0.04
* PC 9: 0.04
* PC 10: 0.04
**Plot 4: "affirmative, affirmative German"**
* Trend: Similar to the first plot, with a slightly lower initial variance.
* Data Points (approximate):
* PC 1: 0.42
* PC 2: 0.11
* PC 3: 0.07
* PC 4: 0.06
* PC 5: 0.05
* PC 6: 0.04
* PC 7: 0.04
* PC 8: 0.04
* PC 9: 0.04
* PC 10: 0.04
**Plot 5: "affirmative, affirmative German, negated, negated German"**
* Trend: Similar to the previous plots, with a slightly lower initial variance.
* Data Points (approximate):
* PC 1: 0.32
* PC 2: 0.13
* PC 3: 0.08
* PC 4: 0.06
* PC 5: 0.05
* PC 6: 0.04
* PC 7: 0.04
* PC 8: 0.04
* PC 9: 0.04
* PC 10: 0.04
**Plot 6: "affirmative, negated, conjunctions, disjunctions"**
* Trend: Similar to the previous plots, with a slightly lower initial variance.
* Data Points (approximate):
* PC 1: 0.27
* PC 2: 0.11
* PC 3: 0.07
* PC 4: 0.06
* PC 5: 0.05
* PC 6: 0.04
* PC 7: 0.04
* PC 8: 0.04
* PC 9: 0.04
* PC 10: 0.04
### Key Observations
* All plots exhibit a similar pattern: a rapid decrease in explained variance for the first few PCs, followed by a plateau.
* The "affirmative" condition consistently shows the highest explained variance, particularly for PC 1.
* Adding negation, conjunctions, disjunctions, and German language elements generally reduces the explained variance, especially for PC 1.
* The explained variance for PCs 3-10 is relatively consistent across all conditions.
### Interpretation
The plots suggest that the first PC captures a significant amount of variance in the data, particularly for the "affirmative" condition. This implies that the first PC represents a dominant feature or pattern associated with affirmative statements. As linguistic complexity increases (through negation, conjunctions, disjunctions, or the inclusion of German), the explained variance decreases, indicating that these features introduce more variability and require more PCs to capture the underlying structure. The plateau in explained variance for higher PCs suggests that these components contribute less to the overall variance and may represent noise or less salient features. The consistent pattern across conditions suggests a general principle: simpler linguistic structures are more efficiently represented by fewer PCs, while more complex structures require more components.