## Scatter Plot Grid: Fraction of Variance Explained by Principal Components
### Overview
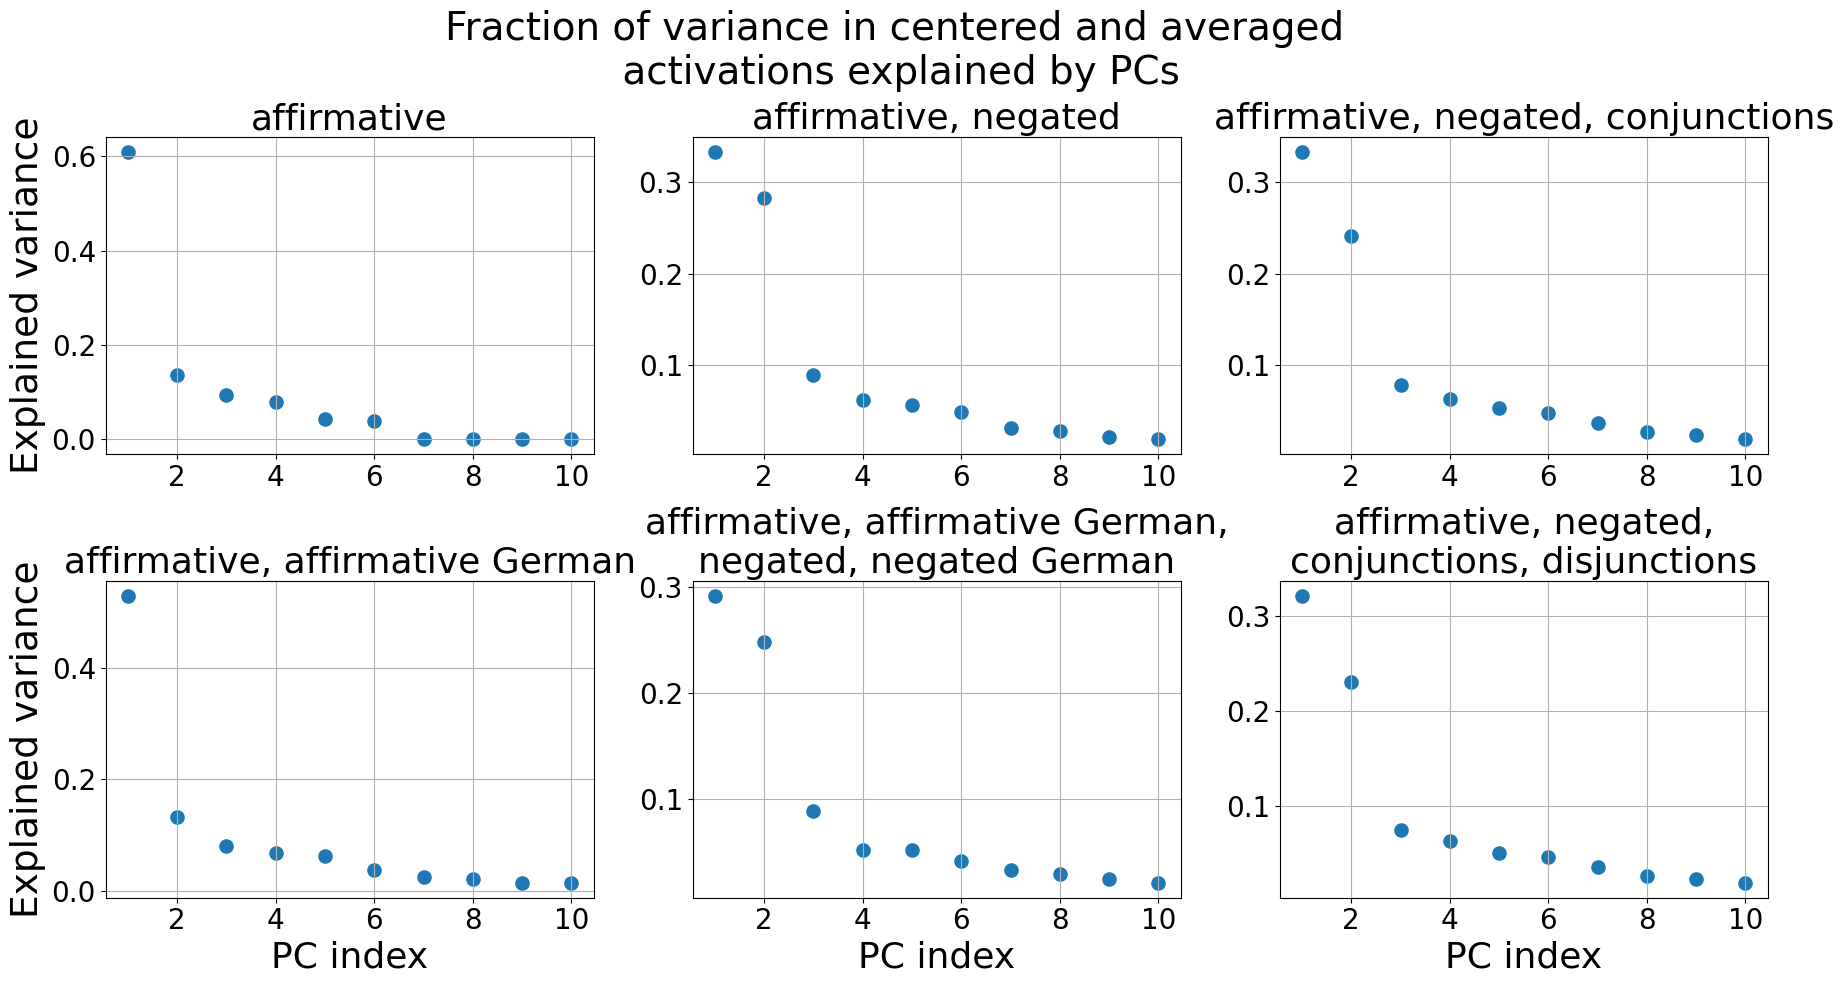
The image displays a 2x3 grid of six scatter plots. The overall title is "Fraction of variance in centered and averaged activations explained by PCs." Each subplot shows the "Explained variance" (y-axis) for the first 10 Principal Components (PCs), indexed on the x-axis. The plots compare how the variance structure changes when the underlying data (likely neural activations) is derived from different sets of linguistic conditions.
### Components/Axes
* **Overall Title:** "Fraction of variance in centered and averaged activations explained by PCs"
* **X-axis (Common to all plots):** "PC index", with major tick marks at 2, 4, 6, 8, and 10. The index runs from 1 to 10.
* **Y-axis (Common to all plots):** "Explained variance". The scale varies slightly between plots to accommodate the data range.
* **Data Series:** Each plot contains a single data series represented by blue circular markers. There is no legend, as each plot is defined by its title.
* **Subplot Titles (Defining the linguistic conditions):**
1. Top-left: "affirmative"
2. Top-center: "affirmative, negated"
3. Top-right: "affirmative, negated, conjunctions"
4. Bottom-left: "affirmative, affirmative German"
5. Bottom-center: "affirmative, affirmative German, negated, negated German"
6. Bottom-right: "affirmative, negated, conjunctions, disjunctions"
### Detailed Analysis
**Trend Verification:** All six plots exhibit the same fundamental trend: a steep, monotonic decrease in explained variance as the PC index increases. The first PC explains the vast majority of the variance, with a sharp drop to the second PC, followed by a more gradual decline.
**Data Point Extraction (Approximate values):**
* **Plot 1: "affirmative"**
* PC1: ~0.61
* PC2: ~0.14
* PC3: ~0.10
* PC4: ~0.08
* PC5: ~0.04
* PC6: ~0.03
* PCs 7-10: All near 0.00
* **Plot 2: "affirmative, negated"**
* PC1: ~0.33
* PC2: ~0.28
* PC3: ~0.09
* PC4: ~0.07
* PC5: ~0.06
* PC6: ~0.05
* PC7: ~0.03
* PC8: ~0.02
* PC9: ~0.01
* PC10: ~0.01
* **Plot 3: "affirmative, negated, conjunctions"**
* PC1: ~0.33
* PC2: ~0.24
* PC3: ~0.08
* PC4: ~0.07
* PC5: ~0.06
* PC6: ~0.05
* PC7: ~0.04
* PC8: ~0.03
* PC9: ~0.02
* PC10: ~0.02
* **Plot 4: "affirmative, affirmative German"**
* PC1: ~0.55
* PC2: ~0.13
* PC3: ~0.08
* PC4: ~0.07
* PC5: ~0.06
* PC6: ~0.03
* PC7: ~0.02
* PC8: ~0.02
* PC9: ~0.01
* PC10: ~0.01
* **Plot 5: "affirmative, affirmative German, negated, negated German"**
* PC1: ~0.29
* PC2: ~0.25
* PC3: ~0.09
* PC4: ~0.05
* PC5: ~0.05
* PC6: ~0.04
* PC7: ~0.03
* PC8: ~0.02
* PC9: ~0.02
* PC10: ~0.01
* **Plot 6: "affirmative, negated, conjunctions, disjunctions"**
* PC1: ~0.32
* PC2: ~0.23
* PC3: ~0.08
* PC4: ~0.07
* PC5: ~0.06
* PC6: ~0.05
* PC7: ~0.04
* PC8: ~0.03
* PC9: ~0.02
* PC10: ~0.02
### Key Observations
1. **Dominance of PC1:** In all conditions, the first principal component explains a disproportionately large fraction of the total variance.
2. **Impact of Condition Set Complexity:** As more linguistic conditions are added (moving from "affirmative" alone to combinations including negation, conjunctions, disjunctions, and German translations), the variance explained by PC1 decreases significantly (from ~0.61 to ~0.29-0.33). This suggests the data's structure becomes more distributed across dimensions.
3. **Two-Component Structure in Complex Sets:** In plots 2, 3, 5, and 6, PC1 and PC2 together explain a substantial portion of the variance (e.g., ~0.61 in Plot 2, ~0.57 in Plot 3), indicating a possible two-dimensional core structure when negation is involved.
4. **Rapid Dimensionality Reduction:** Across all plots, the explained variance drops to near zero by PC7-10, indicating that the meaningful variance in these centered and averaged activations is captured by a very low-dimensional subspace (likely 2-6 dimensions).
### Interpretation
This analysis reveals how the representational geometry of a system (likely a language model) changes with the complexity of the linguistic input. The "affirmative"-only condition has a highly concentrated representation dominated by a single axis of variation. Introducing negation ("affirmative, negated") splits this variance more evenly between two primary axes, suggesting the model encodes affirmation and negation as somewhat distinct but related dimensions.
Adding further logical operations (conjunctions, disjunctions) or cross-lingual data (German) does not dramatically alter this two-axis structure established by negation, but it does slightly redistribute the variance. The consistent, rapid drop-off after the first few PCs is a classic signature of a low-dimensional manifold underlying the high-dimensional activation space. This implies that despite the complexity of language, the core variations in how the model processes these specific sentence types can be understood through a small number of interpretable components. The data suggests that negation is a fundamental axis of variation in the model's internal representations, more so than logical connectives or translation.