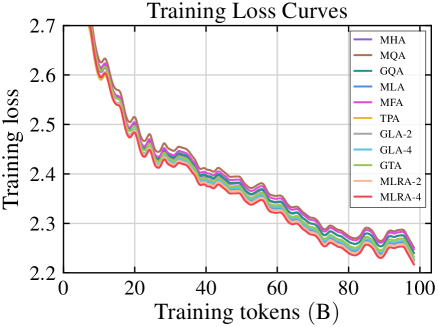
## Line Chart: Training Loss Curves
### Overview
The chart displays training loss curves for multiple algorithms over 100 training tokens (B). All curves show a downward trend in training loss, starting near 2.7 and converging toward 2.2 by 100 tokens. Lines are closely grouped, with minor fluctuations, suggesting similar performance across algorithms.
### Components/Axes
- **X-axis**: "Training tokens (B)" (0 to 100, linear scale).
- **Y-axis**: "Training loss" (2.2 to 2.7, linear scale).
- **Legend**: Located at the top-right, listing 11 algorithms with color-coded lines:
- MHA (purple)
- MQA (brown)
- GQA (teal)
- MLA (blue)
- MFA (pink)
- TPA (yellow)
- GLA-2 (gray)
- GLA-4 (light blue)
- GTA (green)
- MLRA-2 (orange)
- MLRA-4 (red)
### Detailed Analysis
- **Line Trends**:
- All lines exhibit a consistent downward slope, indicating reduced training loss as tokens increase.
- **MLRA-4 (red)** shows the steepest initial decline, reaching ~2.35 by 100 tokens.
- **GTA (green)** and **MLRA-2 (orange)** exhibit slightly more fluctuation but follow the same general trend.
- **TPA (yellow)** and **GLA-4 (light blue)** remain marginally higher (~2.38–2.40) at 100 tokens.
- **Key Data Points**:
- At 0 tokens: All lines start near 2.7.
- At 50 tokens: Most lines cluster between 2.35–2.40.
- At 100 tokens: Lines converge between 2.25–2.35.
### Key Observations
1. **Convergence**: All algorithms show similar performance by 100 tokens, with losses within ~0.1 of each other.
2. **Early Performance**: MLRA-4 demonstrates the fastest initial improvement, suggesting superior optimization in early training stages.
3. **Stability**: Lines exhibit minor oscillations (e.g., ~2.38–2.42 at 40 tokens), indicating minor instability in loss reduction.
### Interpretation
The chart suggests that all tested algorithms effectively reduce training loss over time, with **MLRA-4** outperforming others in early-stage optimization. The convergence of lines by 100 tokens implies diminishing returns in performance differentiation as training progresses. The minor fluctuations highlight potential sensitivity to hyperparameters or data noise. This analysis could guide algorithm selection for tasks prioritizing rapid initial loss reduction.