TECHNICAL ASSET FINGERPRINT
66ba3773d3ee6fe3fb215f38
Click to view fullscreen
Press ESC or click to close
FOUND IN PAPERS
EXPERT: gemma-3-27b-it-free VERSION 1
RUNTIME: google-free/gemma-3-27b-it
INTEL_VERIFIED
\n
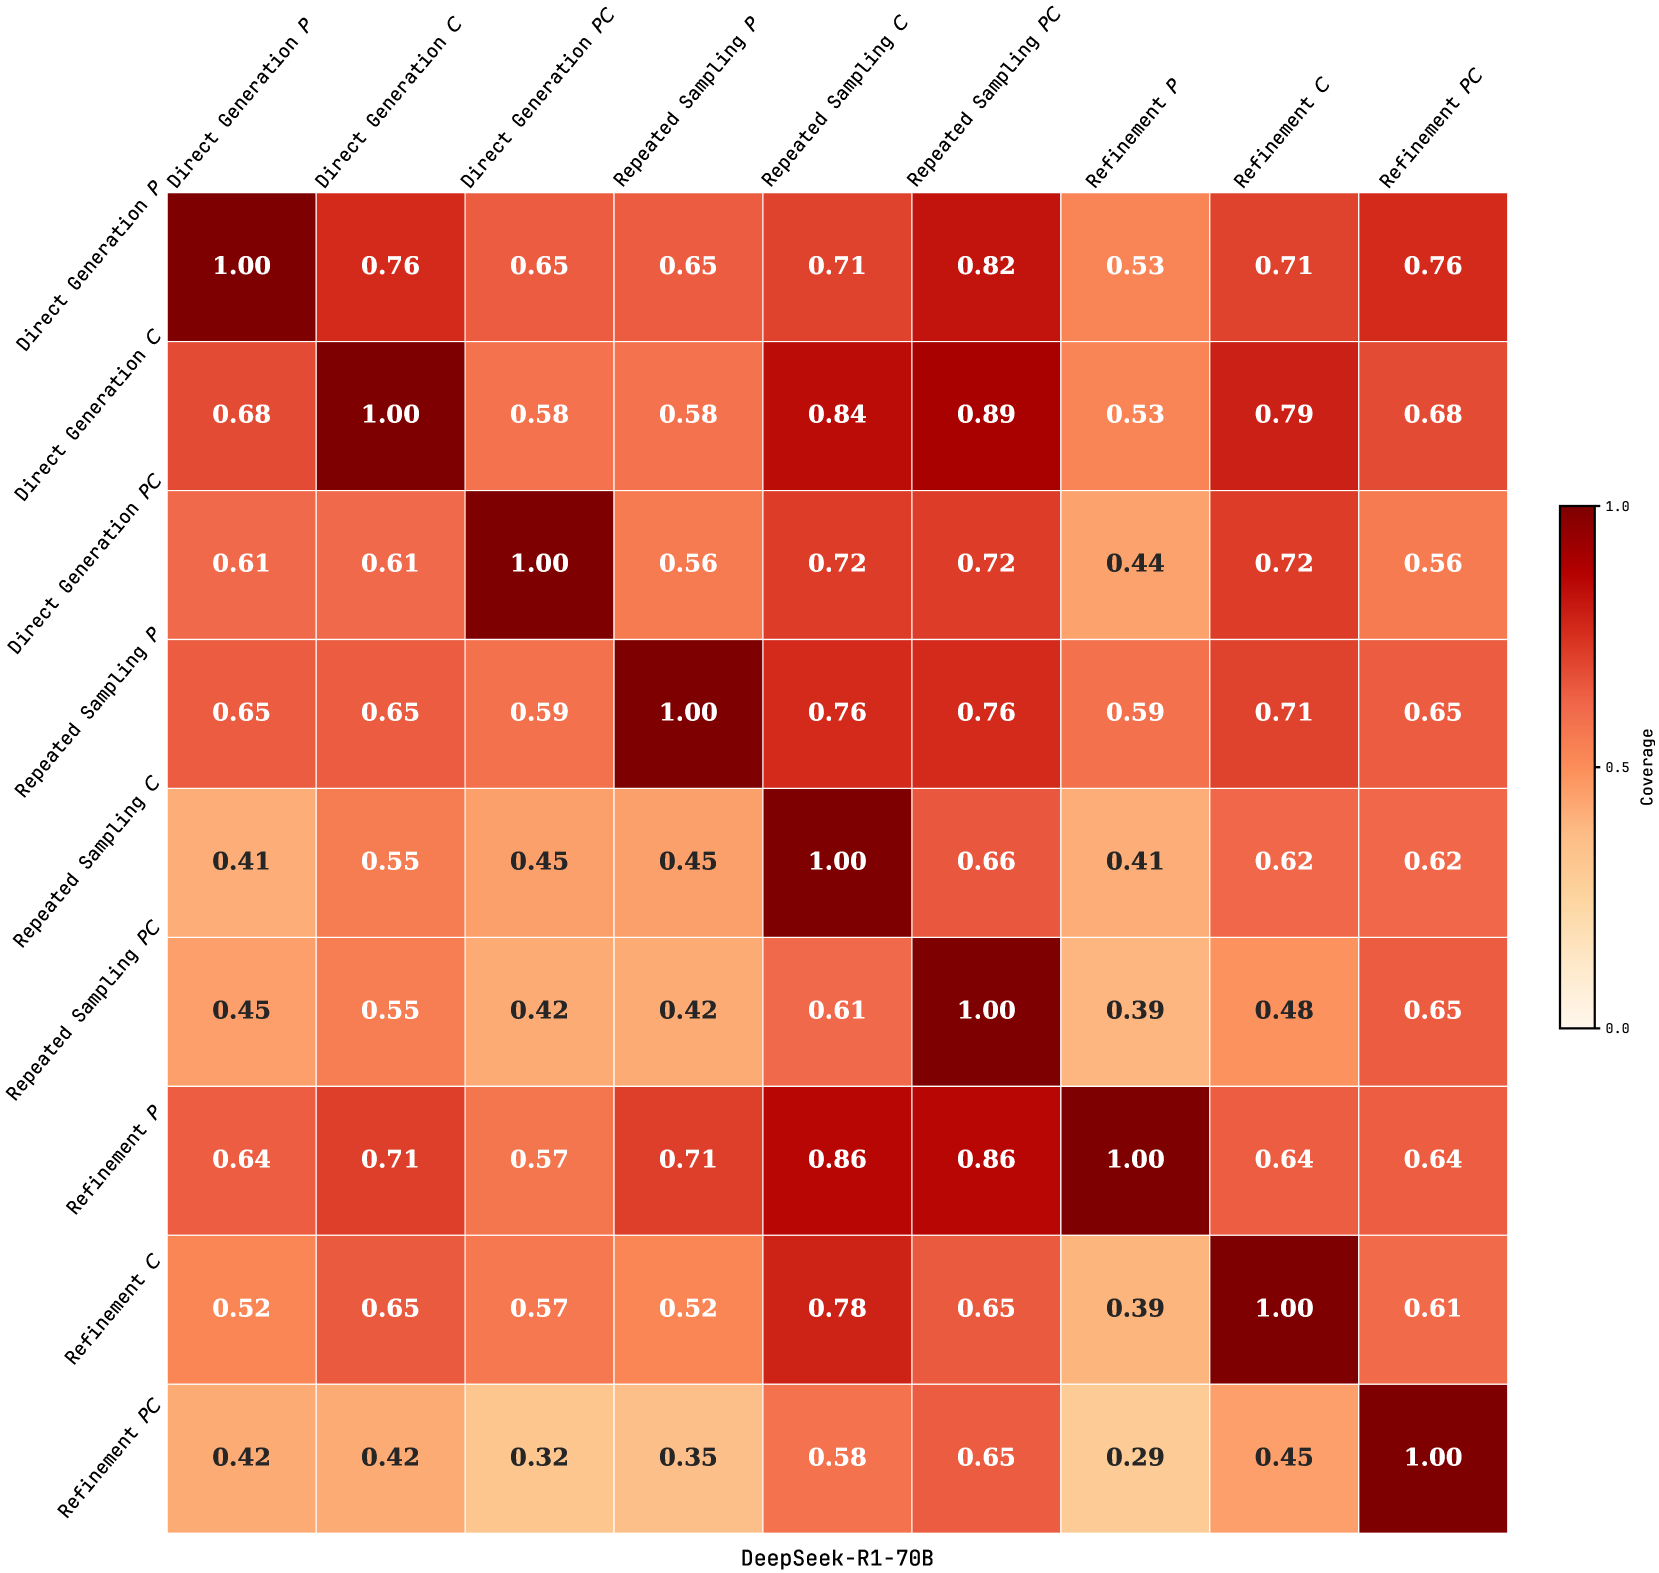
## Heatmap: Correlation Matrix of DeepSeek-R1-70B Sampling Methods
### Overview
This image presents a heatmap visualizing the correlation matrix between different sampling methods used with the DeepSeek-R1-70B model. The methods are Direct Generation P, Direct Generation C, Direct Generation PC, Repeated Sampling P, Repeated Sampling C, Repeated Sampling PC, Refinement P, Refinement C, and Refinement PC. The color intensity represents the correlation coefficient, with warmer colors (reds) indicating stronger positive correlations and cooler colors (greens) indicating negative or weaker correlations. A colorbar on the right indicates the mapping between color and correlation value.
### Components/Axes
* **X-axis:** Sampling Methods - Direct Generation P, Direct Generation C, Direct Generation PC, Repeated Sampling P, Repeated Sampling C, Repeated Sampling PC, Refinement P, Refinement C, Refinement PC.
* **Y-axis:** Sampling Methods - Direct Generation P, Direct Generation C, Direct Generation PC, Repeated Sampling P, Repeated Sampling C, Repeated Sampling PC, Refinement P, Refinement C, Refinement PC.
* **Colorbar:** Scale from 0.0 to 1.8, representing the correlation coefficient. Green indicates lower correlation, red indicates higher correlation.
* **Title:** DeepSeek-R1-70B (located at the bottom center)
### Detailed Analysis
The heatmap displays a 9x9 matrix of correlation coefficients. Each cell (i, j) represents the correlation between sampling method i and sampling method j. The diagonal elements are all 1.00, indicating perfect self-correlation.
Here's a breakdown of key correlations, with approximate values and trend descriptions:
* **Direct Generation P vs. Direct Generation C:** Correlation of approximately 0.76.
* **Direct Generation P vs. Direct Generation PC:** Correlation of approximately 0.65.
* **Direct Generation P vs. Repeated Sampling P:** Correlation of approximately 0.65.
* **Direct Generation P vs. Repeated Sampling C:** Correlation of approximately 0.71.
* **Direct Generation P vs. Repeated Sampling PC:** Correlation of approximately 0.82.
* **Direct Generation P vs. Refinement P:** Correlation of approximately 0.53.
* **Direct Generation P vs. Refinement C:** Correlation of approximately 0.71.
* **Direct Generation P vs. Refinement PC:** Correlation of approximately 0.76.
* **Direct Generation C vs. Direct Generation PC:** Correlation of approximately 0.58.
* **Direct Generation C vs. Repeated Sampling P:** Correlation of approximately 0.58.
* **Direct Generation C vs. Repeated Sampling C:** Correlation of approximately 0.84.
* **Direct Generation C vs. Repeated Sampling PC:** Correlation of approximately 0.89.
* **Direct Generation C vs. Refinement P:** Correlation of approximately 0.53.
* **Direct Generation C vs. Refinement C:** Correlation of approximately 0.79.
* **Direct Generation C vs. Refinement PC:** Correlation of approximately 0.68.
* **Direct Generation PC vs. Repeated Sampling P:** Correlation of approximately 0.56.
* **Direct Generation PC vs. Repeated Sampling C:** Correlation of approximately 0.72.
* **Direct Generation PC vs. Repeated Sampling PC:** Correlation of approximately 0.72.
* **Direct Generation PC vs. Refinement P:** Correlation of approximately 0.44.
* **Direct Generation PC vs. Refinement C:** Correlation of approximately 0.72.
* **Direct Generation PC vs. Refinement PC:** Correlation of approximately 0.56.
* **Repeated Sampling P vs. Repeated Sampling C:** Correlation of approximately 0.41.
* **Repeated Sampling P vs. Repeated Sampling PC:** Correlation of approximately 0.45.
* **Repeated Sampling P vs. Refinement P:** Correlation of approximately 0.59.
* **Repeated Sampling P vs. Refinement C:** Correlation of approximately 0.76.
* **Repeated Sampling P vs. Refinement PC:** Correlation of approximately 0.76.
* **Repeated Sampling C vs. Repeated Sampling PC:** Correlation of approximately 0.66.
* **Repeated Sampling C vs. Refinement P:** Correlation of approximately 0.41.
* **Repeated Sampling C vs. Refinement C:** Correlation of approximately 0.62.
* **Repeated Sampling C vs. Refinement PC:** Correlation of approximately 0.62.
* **Repeated Sampling PC vs. Refinement P:** Correlation of approximately 0.42.
* **Repeated Sampling PC vs. Refinement C:** Correlation of approximately 0.61.
* **Repeated Sampling PC vs. Refinement PC:** Correlation of approximately 1.00.
* **Refinement P vs. Refinement C:** Correlation of approximately 0.86.
* **Refinement P vs. Refinement PC:** Correlation of approximately 0.86.
* **Refinement C vs. Refinement PC:** Correlation of approximately 0.65.
The lowest correlations (around 0.3-0.4) are generally found between methods that differ significantly in their approach (e.g., Direct Generation vs. Repeated Sampling, or involving PC vs. not involving PC).
### Key Observations
* Methods within the same category (e.g., Direct Generation P, C, PC) generally exhibit higher correlations with each other than with methods from different categories.
* The "Repeated Sampling" methods show relatively lower correlations with the "Direct Generation" methods.
* "Refinement P" and "Refinement C" have a very strong correlation (0.86).
* The correlations involving "Refinement PC" are generally moderate, suggesting it shares characteristics with both refinement and other sampling methods.
### Interpretation
This correlation matrix provides insights into the relationships between different sampling strategies used with the DeepSeek-R1-70B model. The high correlations within categories suggest that variations within a single sampling approach (e.g., different parameters for Direct Generation) tend to produce similar results. The lower correlations between categories indicate that these approaches explore different aspects of the model's output space.
The strong correlation between Refinement P and Refinement C suggests that these two refinement methods are highly consistent in their behavior. The moderate correlations involving Refinement PC suggest that it combines aspects of both refinement and other sampling techniques.
This information can be valuable for selecting appropriate sampling methods for specific tasks. If a task requires diverse outputs, choosing methods with lower correlations might be beneficial. If consistency is crucial, selecting methods with higher correlations would be preferable. The matrix also highlights potential areas for further investigation, such as understanding why certain methods exhibit low correlations with others.
DECODING INTELLIGENCE...