TECHNICAL ASSET FINGERPRINT
66ba3773d3ee6fe3fb215f38
Click to view fullscreen
Press ESC or click to close
FOUND IN PAPERS
EXPERT: healer-alpha-free VERSION 1
RUNTIME: free/openrouter/healer-alpha
INTEL_VERIFIED
## Heatmap: Coverage Similarity Matrix for DeepSeek-R1-70B
### Overview
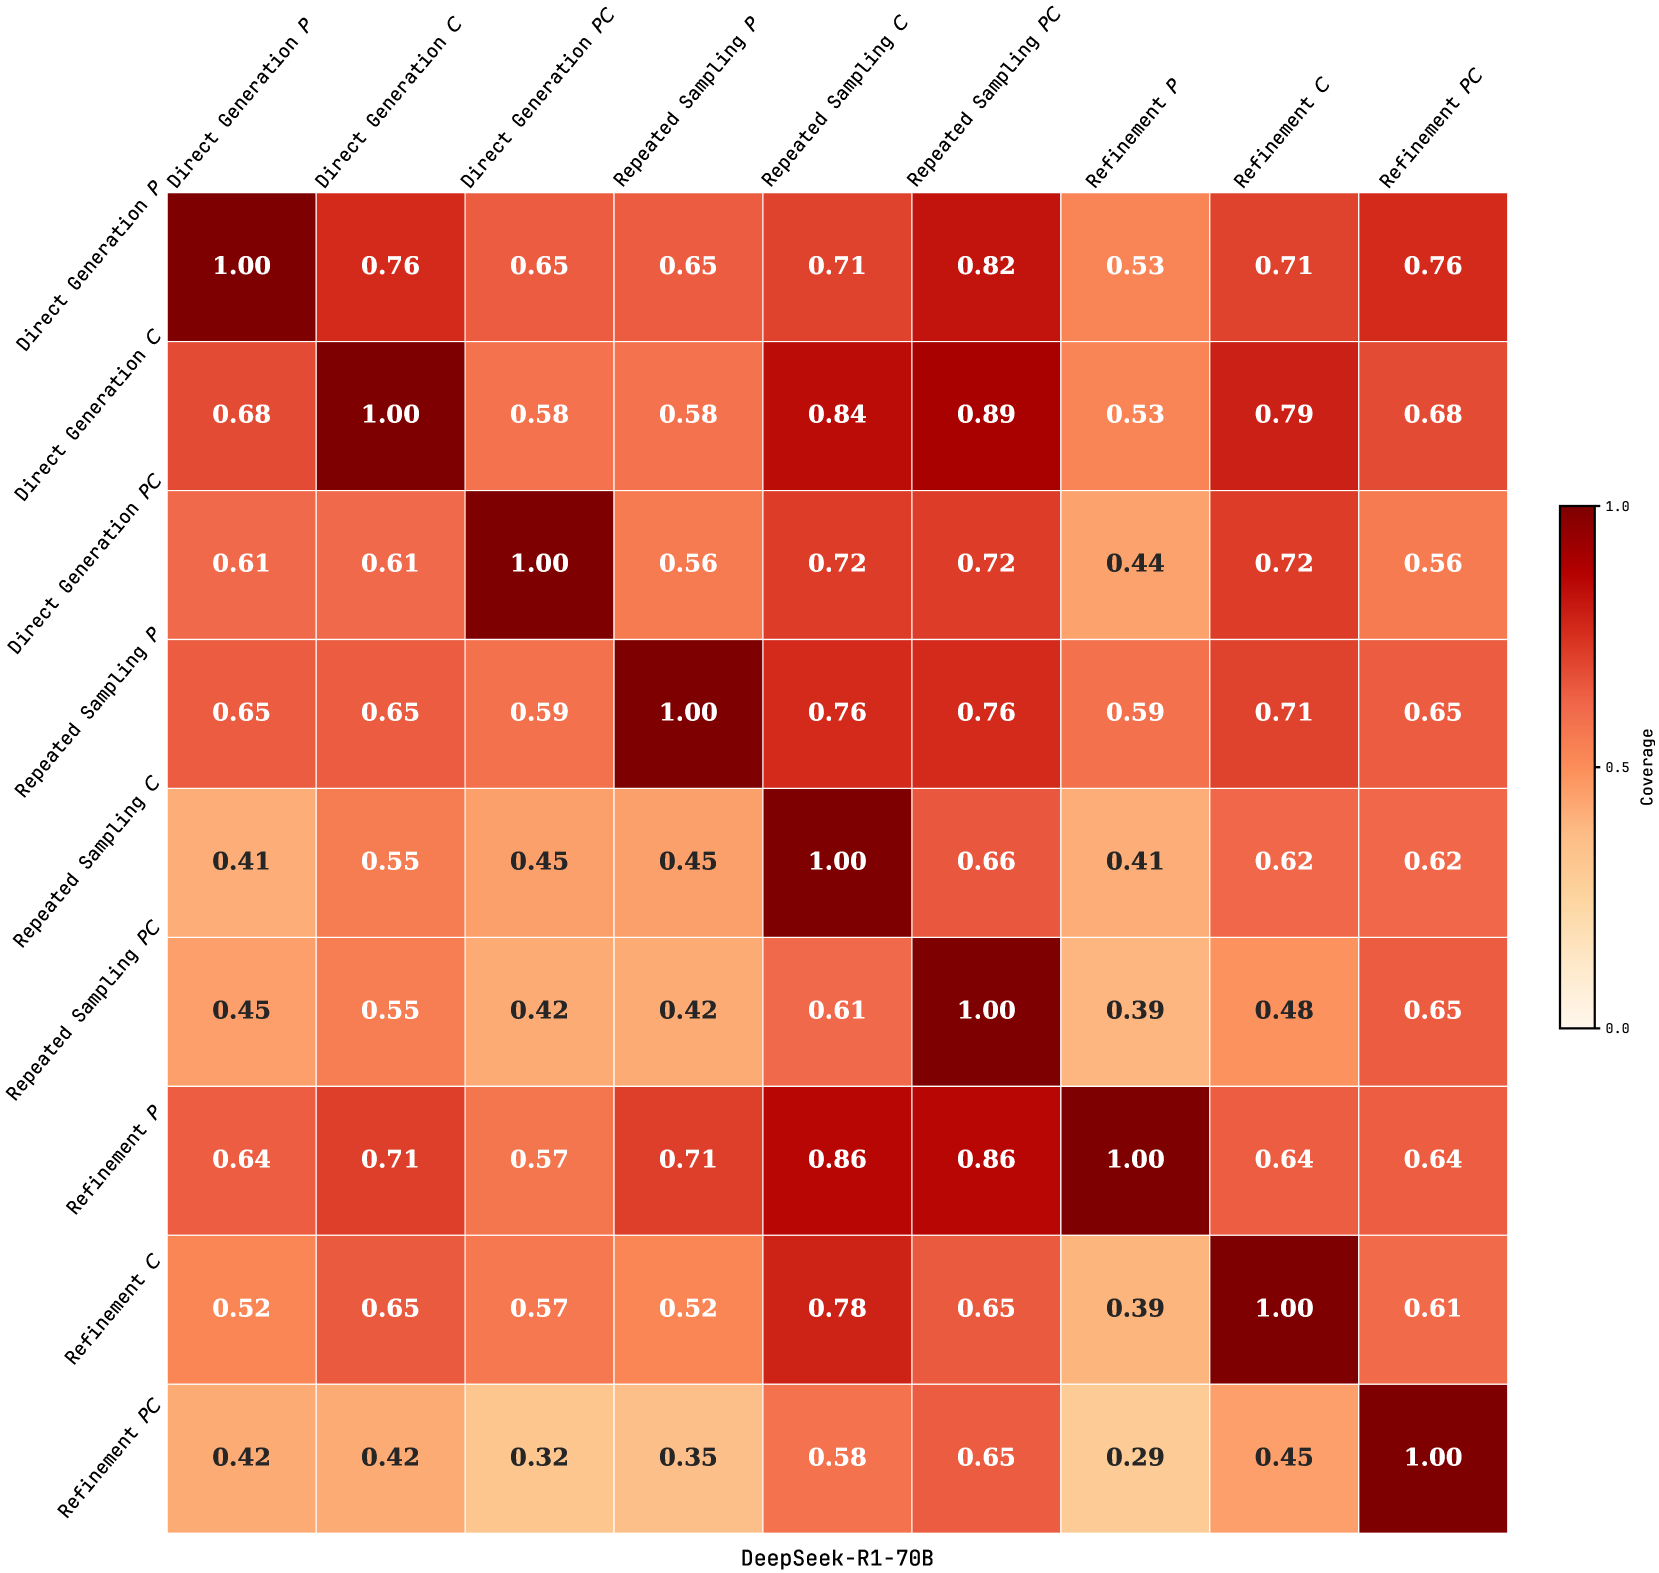
This image is a heatmap visualization displaying a symmetric matrix of "Coverage" values between nine different methods or configurations. The methods are grouped into three categories: Direct Generation, Repeated Sampling, and Refinement, each with three variants (P, C, PC). The heatmap uses a color gradient from light beige (0.0) to dark red (1.0) to represent the coverage value, which is numerically annotated in each cell. The title "DeepSeek-R1-70B" is centered at the bottom.
### Components/Axes
* **Chart Type:** Heatmap (symmetric matrix).
* **Title/Label:** "DeepSeek-R1-70B" (bottom center).
* **Color Scale/Legend:** Located on the right side. It is a vertical bar labeled "Coverage" with a gradient from 0.0 (light beige) to 1.0 (dark red). Key markers are at 0.0, 0.5, and 1.0.
* **X-Axis (Top):** Labels are rotated 45 degrees. From left to right:
1. Direct Generation P
2. Direct Generation C
3. Direct Generation PC
4. Repeated Sampling P
5. Repeated Sampling C
6. Repeated Sampling PC
7. Refinement P
8. Refinement C
9. Refinement PC
* **Y-Axis (Left):** Labels are rotated 45 degrees. From top to bottom, they are identical to the X-axis labels in the same order.
* **Data Grid:** A 9x9 grid of colored cells. Each cell contains a numerical value (coverage) printed in white or black text for contrast against the background color.
### Detailed Analysis
The matrix is symmetric (Value at Row i, Column j = Value at Row j, Column i). The diagonal values are all 1.00, representing perfect coverage similarity of a method with itself.
**Row-by-Row Data Extraction (Coverage Values):**
1. **Direct Generation P:**
* vs. Direct Generation P: **1.00**
* vs. Direct Generation C: 0.76
* vs. Direct Generation PC: 0.65
* vs. Repeated Sampling P: 0.65
* vs. Repeated Sampling C: 0.71
* vs. Repeated Sampling PC: **0.82**
* vs. Refinement P: 0.53
* vs. Refinement C: 0.71
* vs. Refinement PC: 0.76
2. **Direct Generation C:**
* vs. Direct Generation P: 0.68
* vs. Direct Generation C: **1.00**
* vs. Direct Generation PC: 0.58
* vs. Repeated Sampling P: 0.58
* vs. Repeated Sampling C: **0.84**
* vs. Repeated Sampling PC: **0.89**
* vs. Refinement P: 0.53
* vs. Refinement C: 0.79
* vs. Refinement PC: 0.68
3. **Direct Generation PC:**
* vs. Direct Generation P: 0.61
* vs. Direct Generation C: 0.61
* vs. Direct Generation PC: **1.00**
* vs. Repeated Sampling P: 0.56
* vs. Repeated Sampling C: 0.72
* vs. Repeated Sampling PC: 0.72
* vs. Refinement P: **0.44**
* vs. Refinement C: 0.72
* vs. Refinement PC: 0.56
4. **Repeated Sampling P:**
* vs. Direct Generation P: 0.65
* vs. Direct Generation C: 0.65
* vs. Direct Generation PC: 0.59
* vs. Repeated Sampling P: **1.00**
* vs. Repeated Sampling C: 0.76
* vs. Repeated Sampling PC: 0.76
* vs. Refinement P: 0.59
* vs. Refinement C: 0.71
* vs. Refinement PC: 0.65
5. **Repeated Sampling C:**
* vs. Direct Generation P: **0.41**
* vs. Direct Generation C: 0.55
* vs. Direct Generation PC: 0.45
* vs. Repeated Sampling P: 0.45
* vs. Repeated Sampling C: **1.00**
* vs. Repeated Sampling PC: 0.66
* vs. Refinement P: **0.41**
* vs. Refinement C: 0.62
* vs. Refinement PC: 0.62
6. **Repeated Sampling PC:**
* vs. Direct Generation P: 0.45
* vs. Direct Generation C: 0.55
* vs. Direct Generation PC: 0.42
* vs. Repeated Sampling P: 0.42
* vs. Repeated Sampling C: 0.61
* vs. Repeated Sampling PC: **1.00**
* vs. Refinement P: **0.39**
* vs. Refinement C: **0.48**
* vs. Refinement PC: 0.65
7. **Refinement P:**
* vs. Direct Generation P: 0.64
* vs. Direct Generation C: 0.71
* vs. Direct Generation PC: 0.57
* vs. Repeated Sampling P: 0.71
* vs. Repeated Sampling C: **0.86**
* vs. Repeated Sampling PC: **0.86**
* vs. Refinement P: **1.00**
* vs. Refinement C: 0.64
* vs. Refinement PC: 0.64
8. **Refinement C:**
* vs. Direct Generation P: 0.52
* vs. Direct Generation C: 0.65
* vs. Direct Generation PC: 0.57
* vs. Repeated Sampling P: 0.52
* vs. Repeated Sampling C: 0.78
* vs. Repeated Sampling PC: 0.65
* vs. Refinement P: **0.39**
* vs. Refinement C: **1.00**
* vs. Refinement PC: 0.61
9. **Refinement PC:**
* vs. Direct Generation P: 0.42
* vs. Direct Generation C: 0.42
* vs. Direct Generation PC: **0.32**
* vs. Repeated Sampling P: 0.35
* vs. Repeated Sampling C: 0.58
* vs. Repeated Sampling PC: 0.65
* vs. Refinement P: **0.29**
* vs. Refinement C: 0.45
* vs. Refinement PC: **1.00**
### Key Observations
1. **Diagonal Perfection:** All diagonal cells are 1.00 (dark red), confirming each method has perfect coverage overlap with itself.
2. **Highest Off-Diagonal Similarities:** The highest coverage values outside the diagonal are **0.89** (Direct Generation C vs. Repeated Sampling PC) and **0.86** (Refinement P vs. Repeated Sampling C and PC). This suggests strong similarity between these specific method pairs.
3. **Lowest Similarities:** The lowest coverage values are **0.29** (Refinement P vs. Refinement PC) and **0.32** (Direct Generation PC vs. Refinement PC). This indicates these method pairs have the least overlap in coverage.
4. **Pattern by Method Category:**
* Methods within the **"Repeated Sampling"** category (P, C, PC) show relatively high internal similarity (0.61 to 0.76).
* The **"Refinement PC"** method appears to be an outlier, showing generally lower coverage values when compared to most other methods, especially those in the "Direct Generation" and "Refinement P" categories.
* **"Repeated Sampling C"** and **"Repeated Sampling PC"** show very high similarity to **"Refinement P"** (0.86).
5. **Color-Value Correlation:** The color gradient accurately reflects the numerical values. Cells with values ≥0.80 are dark red, values around 0.50 are medium orange, and values ≤0.40 are light beige.
### Interpretation
This heatmap quantifies the similarity in "Coverage" between different generation and refinement strategies for the DeepSeek-R1-70B model. "Coverage" likely measures the overlap in outputs, solutions, or reasoning paths discovered by each method.
* **High Similarity Clusters:** The strong links between "Repeated Sampling" methods and "Refinement P" suggest that the refinement process (P variant) produces results highly consistent with those found through repeated sampling. This could imply that refinement effectively converges on solutions that are also discoverable via brute-force sampling.
* **Distinct Strategies:** The low similarity involving "Refinement PC" indicates it explores a substantially different part of the solution space or uses a fundamentally different approach compared to the other methods, particularly "Direct Generation PC" and "Refinement P".
* **Methodological Insights:** The matrix allows researchers to understand which methods are redundant (high coverage similarity) and which are complementary (low coverage similarity). For instance, combining a method from a high-similarity pair might yield diminishing returns, while combining methods from low-similarity pairs (e.g., "Refinement PC" with "Direct Generation PC") could lead to more comprehensive coverage of the problem space.
* **Asymmetry Note:** While the matrix is visually symmetric, a few off-diagonal pairs show slight numerical asymmetry (e.g., Direct Generation P vs. C is 0.76, while C vs. P is 0.68). This may be due to rounding in the displayed values or a non-symmetric underlying metric. The dominant pattern, however, is symmetry.
DECODING INTELLIGENCE...