\n
## Bar Chart: Disability Status Distribution
### Overview
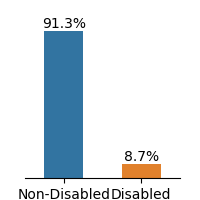
The image displays a simple vertical bar chart comparing two categories: "Non-Disabled" and "Disabled." The chart visually represents a significant disparity in proportions between the two groups, with the "Non-Disabled" category being substantially larger.
### Components/Axes
* **Chart Type:** Vertical Bar Chart.
* **X-Axis (Horizontal):** Represents categorical data. The axis labels are positioned directly below their respective bars.
* **Category 1 (Left Bar):** Label = "Non-Disabled"
* **Category 2 (Right Bar):** Label = "Disabled"
* **Y-Axis (Vertical):** Represents percentage values. The axis line is present, but there are no numerical tick marks or a title label. The values are instead displayed directly above each bar.
* **Data Series:** A single data series is presented, with each bar representing a distinct category.
* **Legend:** There is no separate legend box. The category identification is achieved through the direct labeling on the x-axis.
* **Color Coding:**
* The bar for "Non-Disabled" is colored a medium blue.
* The bar for "Disabled" is colored orange.
* **Data Labels:** Numerical percentage values are placed directly above each bar for precise reading.
### Detailed Analysis
* **Data Point 1 (Non-Disabled):**
* **Category:** Non-Disabled
* **Bar Color:** Blue
* **Value:** 91.3%
* **Visual Trend/Position:** This is the taller bar, located on the left side of the chart. It extends from the baseline (0%) to a height corresponding to 91.3%.
* **Data Point 2 (Disabled):**
* **Category:** Disabled
* **Bar Color:** Orange
* **Value:** 8.7%
* **Visual Trend/Position:** This is the shorter bar, located on the right side of the chart. It extends from the baseline to a height corresponding to 8.7%.
* **Sum Check:** The two values sum to 100.0% (91.3% + 8.7%), indicating the chart likely represents a complete population split into these two mutually exclusive categories.
### Key Observations
1. **Dominant Category:** The "Non-Disabled" group constitutes an overwhelming majority (91.3%) of the represented population.
2. **Significant Disparity:** There is a large gap of 82.6 percentage points between the two categories.
3. **Visual Emphasis:** The height difference between the blue and orange bars creates a strong visual impression of imbalance.
4. **Data Presentation:** The use of direct data labels above the bars ensures precise value communication, compensating for the absence of a scaled y-axis.
### Interpretation
This chart demonstrates a stark demographic or statistical imbalance between individuals identified as "Non-Disabled" and "Disabled" within the specific context of the data source (which is not provided in the image). The 91.3% to 8.7% split suggests that in the measured population, group, or sample, the disabled population is a small minority.
**Potential Implications and Questions (Reading Between the Lines):**
* **Representation:** If this chart represents, for example, workforce composition, survey respondents, or user base, it highlights a potential lack of representation or accessibility for disabled individuals.
* **Context is Critical:** The meaning is entirely dependent on the unstated source and subject. Is this data from a specific country, a company's internal audit, a medical study, or a website's analytics? The absence of a chart title, source note, or y-axis label ("Percentage of...") is a significant limitation for full interpretation.
* **Focus on Binary Classification:** The chart presents disability status as a strict binary. It does not account for spectrum, type, or severity of disability, which is a common simplification in high-level statistical reporting.
* **Call for Investigation:** The primary value of this chart is to pose a question: "Why is this disparity so large?" The data itself doesn't explain the cause—whether it reflects true population demographics, sampling bias, systemic barriers, or measurement criteria. It serves as a starting point for deeper investigation into equity, inclusion, or access within the relevant domain.