## Bar Chart: Percentage Distribution of Non-Disabled vs. Disabled Individuals
### Overview
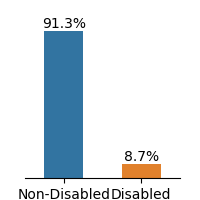
The image is a vertical bar chart comparing the percentage distribution of two categories: "Non-Disabled" and "Disabled." The chart uses two distinct colors (blue and orange) to differentiate the categories, with numerical values displayed atop each bar.
### Components/Axes
- **X-Axis**: Labeled with two categories:
- "Non-Disabled" (left bar)
- "Disabled" (right bar)
- **Y-Axis**: Represents percentage values, scaled from 0% to 100% in increments of 10%.
- **Legend**: Located on the right side of the chart, explicitly mapping colors to categories:
- **Blue**: Non-Disabled
- **Orange**: Disabled
### Detailed Analysis
- **Non-Disabled Bar**:
- Height: 91.3%
- Color: Blue (matches legend)
- Position: Leftmost bar, occupying the majority of the chart’s vertical space.
- **Disabled Bar**:
- Height: 8.7%
- Color: Orange (matches legend)
- Position: Rightmost bar, significantly shorter than the Non-Disabled bar.
### Key Observations
1. The Non-Disabled category dominates the distribution, accounting for **91.3%** of the total.
2. The Disabled category represents a small minority at **8.7%**, creating a stark contrast.
3. The total percentage sums to **100%**, indicating these are mutually exclusive categories within a single population.
### Interpretation
The data suggests a significant disparity in representation between Non-Disabled and Disabled individuals. The overwhelming majority (91.3%) being Non-Disabled implies either:
- A systemic underrepresentation of Disabled individuals in the measured context (e.g., workforce, education, or accessibility metrics).
- A potential data collection bias or exclusion criteria that disproportionately excludes Disabled individuals.
The chart’s simplicity emphasizes the magnitude of the gap, though it lacks contextual details (e.g., sample size, demographic breakdowns, or timeframes) that would clarify the root causes or implications. The use of distinct colors and clear labeling ensures immediate readability, but the absence of error bars or confidence intervals limits statistical rigor.