## Scatter Plot: Lean-SMT vs. Ethos Checking Times
### Overview
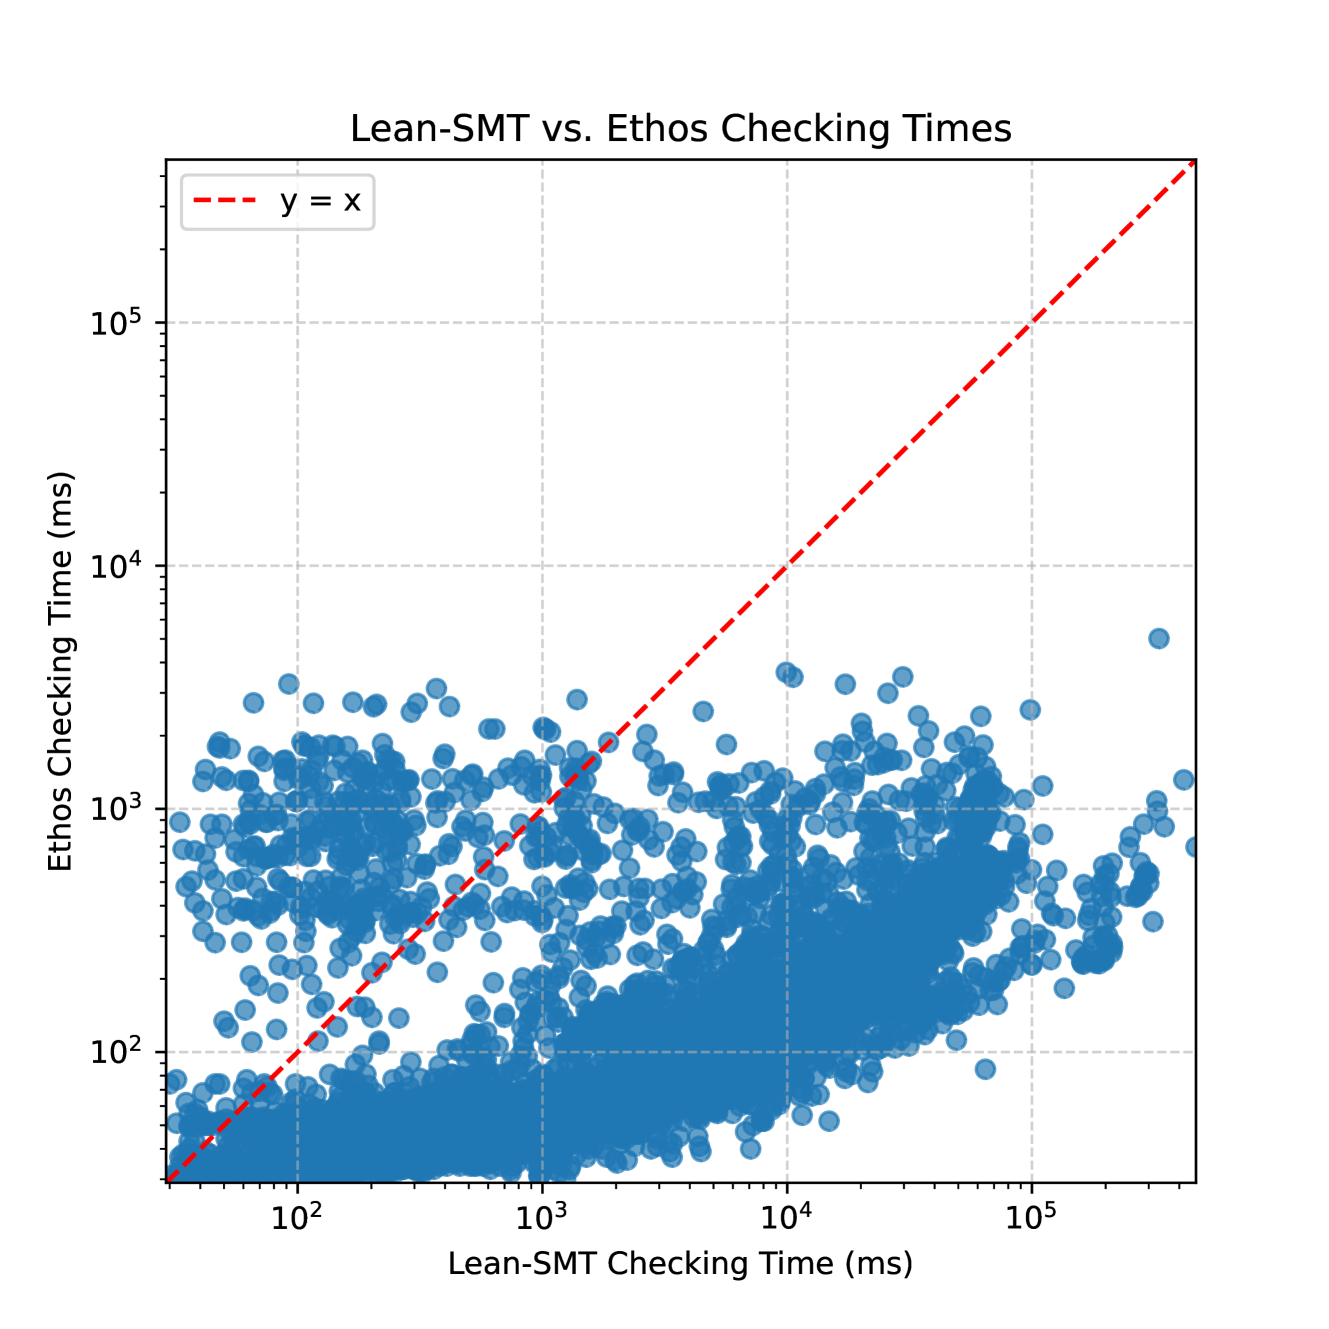
The image is a log-log scatter plot comparing **Lean-SMT Checking Time** (x-axis) and **Ethos Checking Time** (y-axis), both measured in milliseconds (ms). A red dashed line labeled `y = x` serves as a reference for equality between the two metrics. Data points are represented as blue circles, with density varying across the plot.
---
### Components/Axes
- **Title**: "Lean-SMT vs. Ethos Checking Times" (centered at the top).
- **X-axis**:
- Label: "Lean-SMT Checking Time (ms)".
- Scale: Logarithmic, ranging from `10²` (100 ms) to `10⁵` (100,000 ms).
- Ticks: `10²`, `10³`, `10⁴`, `10⁵`.
- **Y-axis**:
- Label: "Ethos Checking Time (ms)".
- Scale: Logarithmic, ranging from `10²` (100 ms) to `10⁵` (100,000 ms).
- Ticks: `10²`, `10³`, `10⁴`, `10⁵`.
- **Legend**:
- Position: Top-left corner.
- Content: Red dashed line labeled `y = x`.
- **Data Points**:
- Color: Blue circles (varying opacity, denser in clusters).
- Distribution: Concentrated in the lower-left (both times <10³ ms) and upper-right (both times >10³ ms) quadrants.
---
### Detailed Analysis
1. **Trend Verification**:
- The red dashed line `y = x` diagonally bisects the plot, indicating where Lean-SMT and Ethos times are equal.
- **Majority of data points** lie **below** the line, suggesting Ethos Checking Time is generally faster than Lean-SMT.
- **Exceptions**: A sparse cluster of points above the line in the middle range (`10³`–`10⁴` ms) indicates Ethos is slower in these cases.
2. **Content Details**:
- **Lower-left quadrant** (`x < 10³`, `y < 10³`): High density of points, showing both systems perform efficiently.
- **Upper-right quadrant** (`x > 10³`, `y > 10³`): Moderate density, indicating slower performance for both systems.
- **Outliers**:
- A few points above `y = x` in the `10³`–`10⁴` ms range (e.g., `x ≈ 5×10³`, `y ≈ 1×10⁴`).
- A single outlier at `x ≈ 10⁵`, `y ≈ 3×10⁴` (Ethos significantly faster than Lean-SMT).
3. **Key Observations**:
- **Correlation**: A weak positive correlation exists; as Lean-SMT time increases, Ethos time tends to increase, but with significant variance.
- **Performance Gap**: Ethos consistently outperforms Lean-SMT in most cases, except for specific mid-range inputs.
- **Log-Scale Insight**: The logarithmic axes emphasize the wide range of input sizes and highlight performance disparities at extreme values.
---
### Interpretation
- **What the Data Suggests**:
- Ethos Checking Time is generally more efficient than Lean-SMT, particularly for small to moderate input sizes (`x < 10³` ms).
- For large inputs (`x > 10⁴` ms), both systems degrade, but Ethos maintains a relative advantage.
- The outliers above `y = x` suggest edge cases where Lean-SMT might outperform Ethos, possibly due to algorithmic differences or input-specific optimizations.
- **Why It Matters**:
- The plot provides empirical evidence for choosing between Lean-SMT and Ethos based on input size and performance requirements.
- The log-log scale reveals scalability patterns, showing that Ethos scales better for large inputs compared to Lean-SMT.
- **Notable Anomalies**:
- The outlier at `x ≈ 10⁵`, `y ≈ 3×10⁴` warrants investigation: Why does Ethos perform so much better here? Could this indicate a bug, a special case, or an optimization in Ethos for extreme inputs?
---
### Spatial Grounding & Validation
- **Legend Placement**: Top-left corner, clearly separated from the plot.
- **Color Consistency**: All data points are blue, matching the legend’s reference (no mismatches).
- **Axis Alignment**: Logarithmic scales ensure proportional representation of values across orders of magnitude.
---
### Final Notes
The plot uses a log-log scale to effectively visualize data spanning four orders of magnitude. While Ethos generally outperforms Lean-SMT, the presence of outliers and mid-range exceptions highlights the need for further analysis of specific input types or system configurations.