## Scatter Plot: Lean-SMT vs. Ethos Checking Times
### Overview
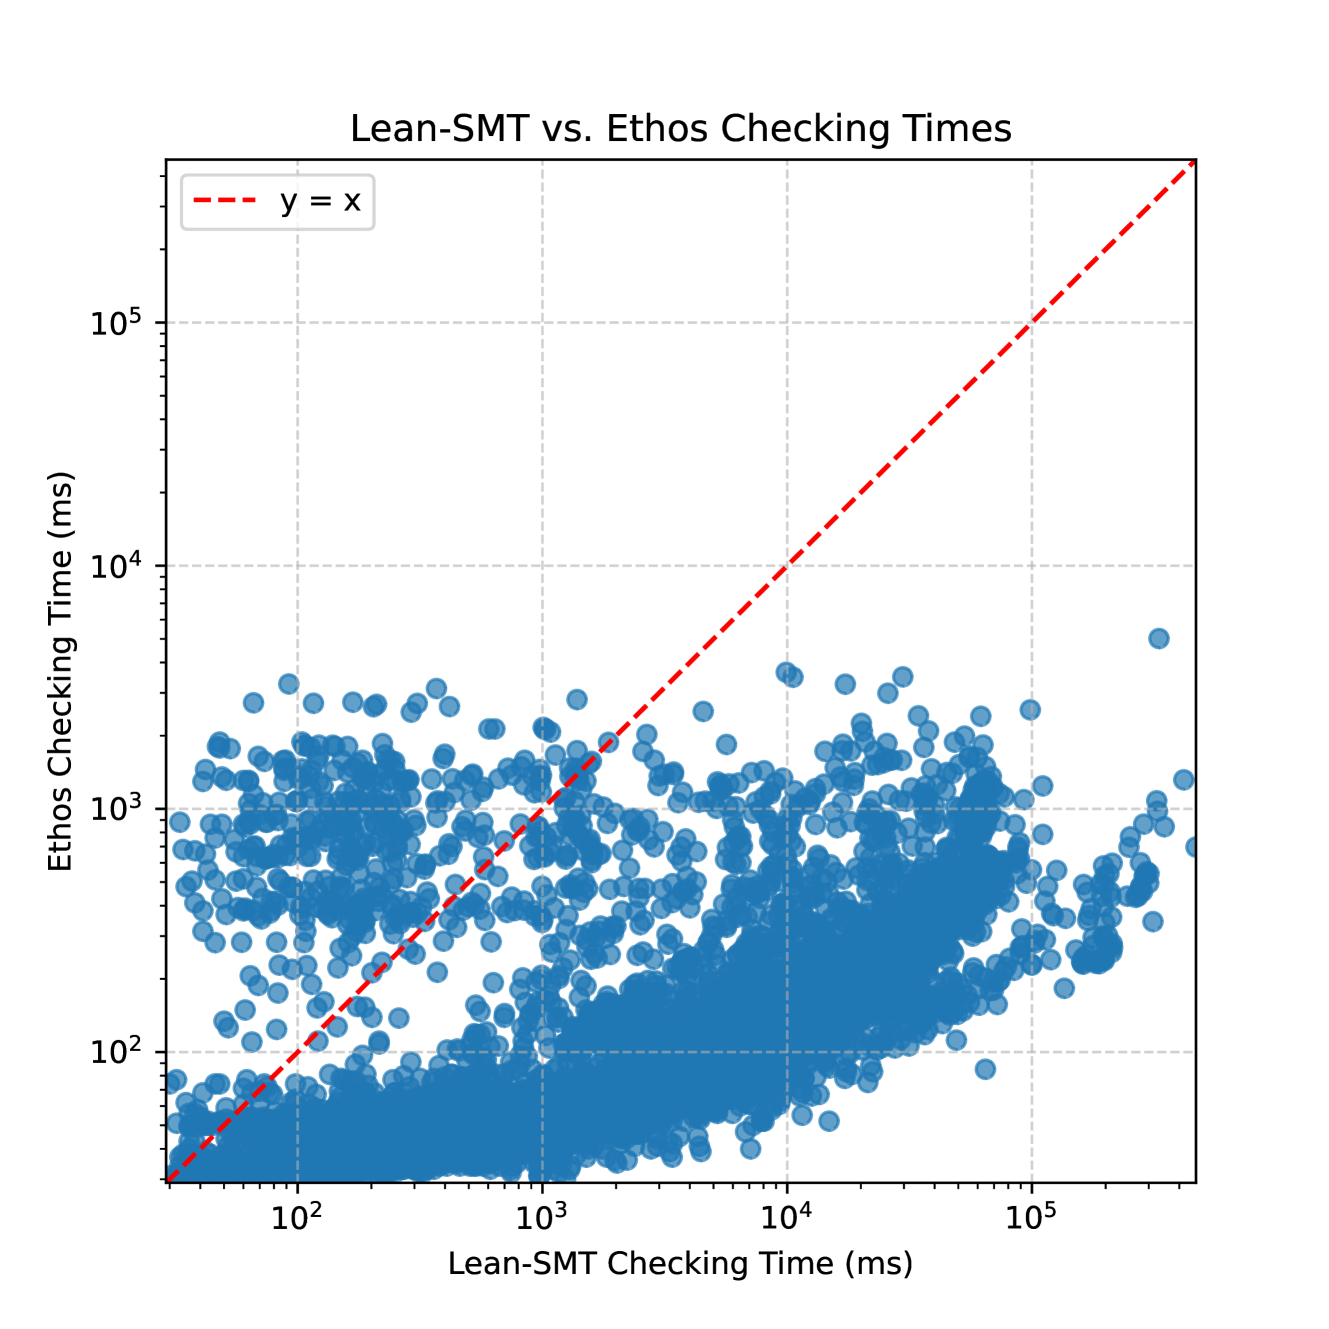
The image is a scatter plot comparing the checking times of Lean-SMT and Ethos. Both axes use a logarithmic scale. The plot includes a red dashed line representing y = x, which serves as a reference for comparing the performance of the two systems. The data points are clustered, showing the relationship between the checking times of the two methods.
### Components/Axes
* **Title:** Lean-SMT vs. Ethos Checking Times
* **X-axis:** Lean-SMT Checking Time (ms) - Logarithmic scale from 10^2 to 10^5
* **Y-axis:** Ethos Checking Time (ms) - Logarithmic scale from 10^2 to 10^5
* **Grid:** Light gray dashed grid lines are present.
* **Legend:** Located in the top-left corner.
* Red dashed line: y = x
### Detailed Analysis
* **Data Points:** The data points are blue circles.
* **y = x Line:** A red dashed line represents y = x. This line indicates where the checking times for Lean-SMT and Ethos are equal.
* **Data Point Distribution:**
* Most data points are clustered below the y = x line, indicating that Ethos generally has lower checking times than Lean-SMT.
* There is a concentration of points in the lower-left corner, suggesting many instances where both systems have relatively low checking times.
* There are some outliers above the y = x line, indicating cases where Ethos checking times are higher than Lean-SMT.
* **X-Axis Markers:** 10^2, 10^3, 10^4, 10^5
* **Y-Axis Markers:** 10^2, 10^3, 10^4, 10^5
### Key Observations
* Ethos generally has lower checking times than Lean-SMT, as most data points are below the y = x line.
* There is a wide range of checking times for both systems, spanning several orders of magnitude.
* The clustering of points suggests a correlation between the checking times of the two systems.
### Interpretation
The scatter plot provides a visual comparison of the checking times between Lean-SMT and Ethos. The fact that most data points lie below the y = x line suggests that Ethos is generally faster than Lean-SMT for the given set of checks. However, the presence of outliers above the line indicates that there are cases where Lean-SMT outperforms Ethos. The logarithmic scale highlights the wide range of checking times, and the clustering of points suggests a relationship between the performance of the two systems. The plot could be used to further investigate the specific conditions under which each system performs better.