\n
## Scatter Plot: Lean-SMT vs. Ethos Checking Times
### Overview
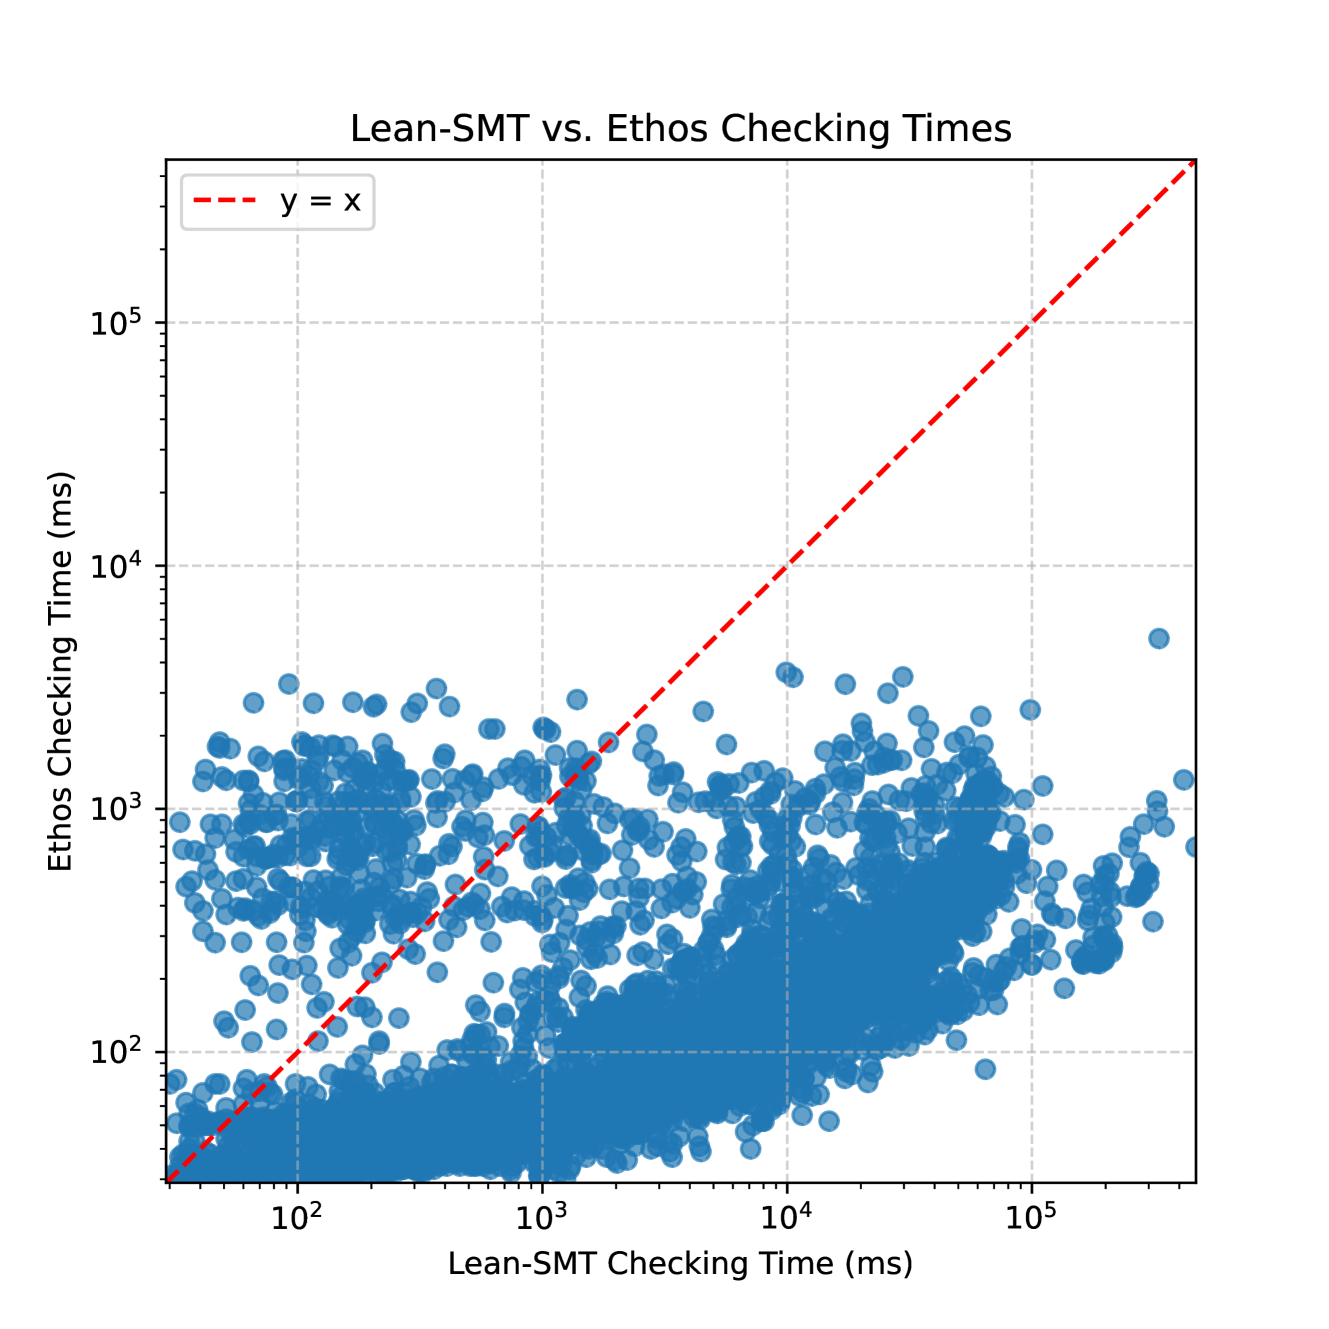
This image presents a scatter plot comparing Lean-SMT checking times to Ethos checking times, both measured in milliseconds (ms). A dashed red line representing y=x is overlaid on the plot, serving as a reference for equal checking times. The plot displays a large number of data points, suggesting a substantial dataset.
### Components/Axes
* **Title:** Lean-SMT vs. Ethos Checking Times
* **X-axis:** Lean-SMT Checking Time (ms) - Logarithmic scale. Markers are approximately: 10^2, 10^3, 10^4, 10^5.
* **Y-axis:** Ethos Checking Time (ms) - Logarithmic scale. Markers are approximately: 10^2, 10^3, 10^4, 10^5.
* **Legend:**
* `y = x` - Dashed red line.
* **Data Points:** A large number of blue circular data points.
### Detailed Analysis
The scatter plot shows a generally positive correlation between Lean-SMT checking time and Ethos checking time. However, the relationship is not strictly linear.
* **Trend:** For Lean-SMT checking times below approximately 10^3 ms, the Ethos checking times are generally lower than the Lean-SMT checking times. As Lean-SMT checking time increases beyond 10^3 ms, the Ethos checking times tend to be higher, and the spread of data points increases significantly.
* **Data Point Distribution:**
* **Low Lean-SMT Times (10^2 ms):** Ethos checking times range from approximately 10^2 to 10^3 ms.
* **Mid-Range Lean-SMT Times (10^3 ms):** Ethos checking times are widely distributed, ranging from approximately 10^2 to 10^4 ms.
* **High Lean-SMT Times (10^4 - 10^5 ms):** Ethos checking times are also widely distributed, ranging from approximately 10^2 to 10^5 ms.
* **y = x Line:** The dashed red line (y=x) represents the point where Lean-SMT and Ethos checking times are equal. Most data points fall *above* this line, indicating that Ethos checking times are generally longer than Lean-SMT checking times.
* **Outliers:** There are a few data points with very high Ethos checking times (approaching 10^5 ms) even for relatively low Lean-SMT checking times. These represent potential outliers or cases where Ethos checking is significantly slower.
### Key Observations
* Ethos checking times are generally longer than Lean-SMT checking times.
* The relationship between the two checking times is not strictly linear, and the spread of Ethos checking times increases with increasing Lean-SMT checking times.
* There are outliers where Ethos checking times are significantly longer than Lean-SMT checking times.
* The logarithmic scale on both axes compresses the data, making it difficult to discern precise values without further analysis.
### Interpretation
The data suggests that while there is a correlation between Lean-SMT and Ethos checking times, Ethos checking is often slower. The increasing spread of data points at higher Lean-SMT checking times indicates that the performance difference between the two systems becomes more variable as the complexity of the checking task increases. The outliers suggest that there are specific cases where Ethos checking is particularly slow, potentially due to specific features or complexities in the input.
The y=x line serves as a benchmark. The fact that most points lie above it implies that Ethos is generally less efficient than Lean-SMT. The deviation from this line increases with the Lean-SMT checking time, suggesting that the performance gap widens for more complex tasks.
Further investigation is needed to understand the reasons for the outliers and the increasing variability in Ethos checking times. This could involve analyzing the specific inputs that lead to these slower checking times and identifying potential optimizations for the Ethos system. The use of a logarithmic scale suggests that the data spans several orders of magnitude, and the relationship between the two checking times may be better understood by examining the data in more detail.