## Flowchart: Rule-Based Decision Making
### Overview
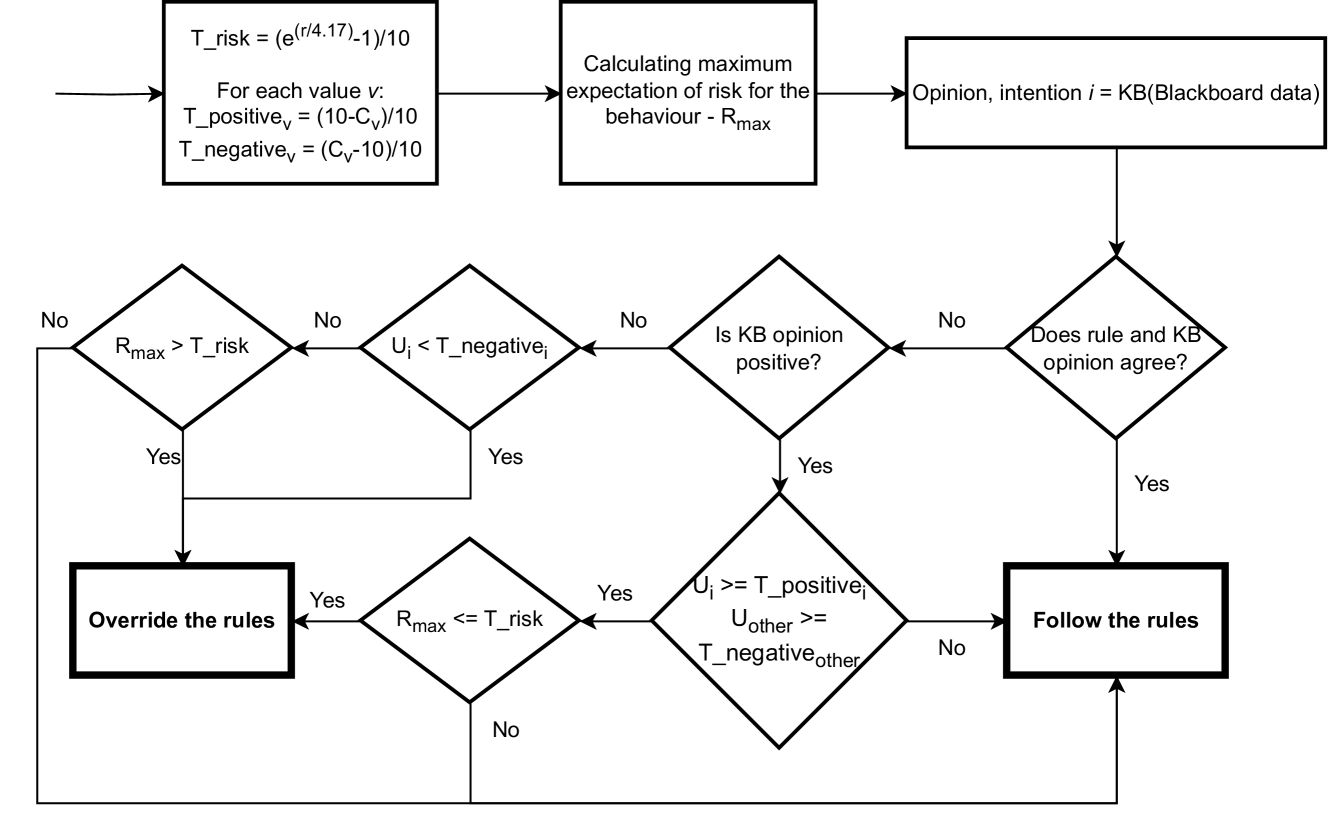
The image is a flowchart illustrating a rule-based decision-making process. It outlines the steps involved in determining whether to override or follow a set of rules based on risk assessment, opinion analysis, and agreement between rules and knowledge base (KB) opinions.
### Components/Axes
The flowchart consists of the following components:
1. **Rectangular Boxes:** Represent processes or calculations.
2. **Diamond Shapes:** Represent decision points or conditions.
3. **Arrows:** Indicate the flow of the process.
4. **Text Labels:** Describe the processes, conditions, and outcomes.
The flowchart includes the following variables and parameters:
* `T_risk`: Risk threshold. Calculated as `(e^(r/4.17) - 1) / 10`.
* `r`: Input to the risk calculation.
* `T_positive_v`: Positive threshold for value `v`. Calculated as `(10 - C_v) / 10`.
* `C_v`: Input to the positive threshold calculation.
* `T_negative_v`: Negative threshold for value `v`. Calculated as `(C_v - 10) / 10`.
* `R_max`: Maximum expectation of risk for the behavior.
* `Opinion, intention i`: Knowledge Base (KB) data from the blackboard.
* `U_i`: Variable being compared to thresholds.
* `U_other`: Another variable being compared to thresholds.
* `T_negative_i`: Negative threshold for variable `U_i`.
* `T_positive_i`: Positive threshold for variable `U_i`.
* `T_negative_other`: Negative threshold for variable `U_other`.
### Detailed Analysis or Content Details
The flowchart begins with the calculation of `T_risk`, `T_positive_v`, and `T_negative_v`. The process then proceeds as follows:
1. **Calculate Maximum Expectation of Risk:** The maximum expectation of risk for the behavior (`R_max`) is calculated.
2. **Obtain Opinion/Intention:** The opinion or intention `i` is obtained from the Knowledge Base (KB) data on the blackboard.
3. **Decision 1:** Is `R_max > T_risk`?
* If **Yes**, proceed to "Override the rules".
* If **No**, proceed to Decision 2.
4. **Decision 2:** Is `U_i < T_negative_i`?
* If **Yes**, proceed to "Override the rules".
* If **No**, proceed to Decision 3.
5. **Decision 3:** Is KB opinion positive?
* If **Yes**, proceed to Decision 5.
* If **No**, proceed to Decision 4.
6. **Decision 4:** Does rule and KB opinion agree?
* If **Yes**, proceed to "Follow the rules".
* If **No**, proceed to Decision 5.
7. **Decision 5:** Is `U_i >= T_positive_i` and `U_other >= T_negative_other`?
* If **Yes**, proceed to "Follow the rules".
* If **No**, proceed to Decision 6.
8. **Decision 6:** Is `R_max <= T_risk`?
* If **Yes**, proceed to "Override the rules".
* If **No**, proceed to "Follow the rules".
The flowchart has two final outcomes:
* **Override the rules:** This outcome is reached if `R_max > T_risk`, `U_i < T_negative_i`, or `R_max <= T_risk` after the KB opinion and other conditions are evaluated.
* **Follow the rules:** This outcome is reached if the rule and KB opinion agree, or if `U_i >= T_positive_i` and `U_other >= T_negative_other` are true, or if `R_max <= T_risk` is false after the KB opinion and other conditions are evaluated.
### Key Observations
* The flowchart integrates risk assessment, opinion analysis, and rule-based logic.
* The decision to override or follow the rules depends on multiple factors and thresholds.
* The KB opinion plays a significant role in the decision-making process.
### Interpretation
The flowchart represents a system designed to make decisions based on a combination of quantitative risk assessment and qualitative opinion analysis. The system first calculates a risk threshold (`T_risk`) and compares it to the maximum expected risk (`R_max`). If the expected risk exceeds the threshold, the rules are overridden. Otherwise, the system considers the KB opinion and other conditions to determine whether to follow or override the rules.
The inclusion of KB opinion suggests that the system is designed to incorporate human judgment or expert knowledge into the decision-making process. The flowchart provides a structured framework for integrating these different factors and making consistent decisions. The multiple decision points and feedback loops indicate that the system is designed to handle complex scenarios and adapt to changing conditions.