## Flowchart: Decision-Making Logic for Rule Override
### Overview
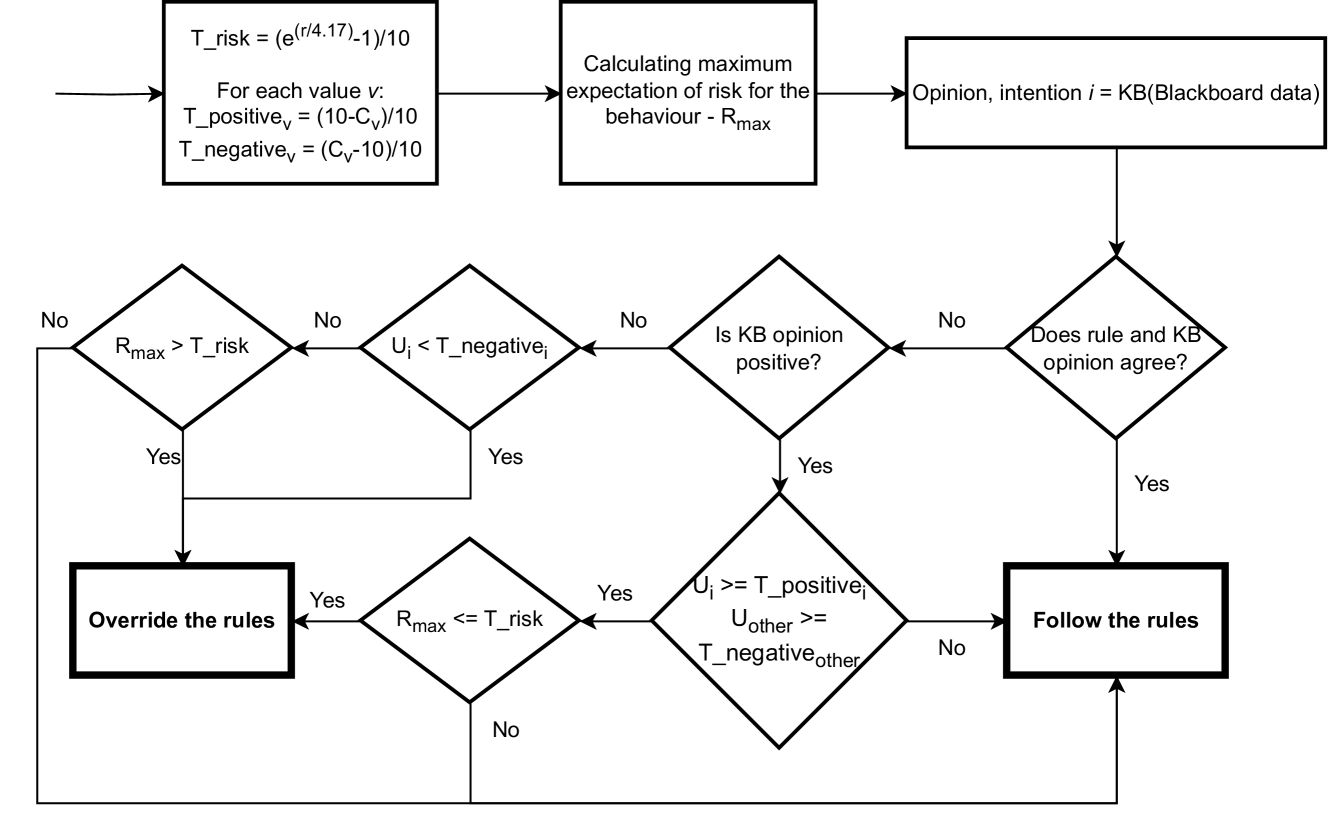
This image displays a logic flowchart representing an automated decision-making process. The system evaluates a set of rules against a "Knowledge Base" (KB) opinion, incorporating risk assessment calculations to determine whether to "Follow the rules" or "Override the rules." It appears to be a control logic diagram for an autonomous agent or an expert system.
### Components/Axes
The diagram is structured into three distinct functional areas:
1. **Initialization/Calculation (Top Row):** Three rectangular process blocks defining the mathematical inputs and the KB opinion retrieval.
2. **Decision Logic (Middle/Bottom):** A series of diamond-shaped decision nodes that evaluate conditions based on the calculated inputs.
3. **Outcomes (Bottom):** Two bolded rectangular blocks representing the final actions: "Override the rules" or "Follow the rules."
### Detailed Analysis
#### 1. Initialization (Top Row)
* **Process Block 1 (Left):** Defines risk thresholds.
* $T_{risk} = (e^{r/4.17} - 1) / 10$
* For each value $v$:
* $T_{positive_v} = (10 - C_v) / 10$
* $T_{negative_v} = (C_v - 10) / 10$
* **Process Block 2 (Center):** "Calculating maximum expectation of risk for the behaviour - $R_{max}$"
* **Process Block 3 (Right):** "Opinion, intention $i = KB(\text{Blackboard data})$"
#### 2. Decision Logic Flow
The flow proceeds from the initialization blocks into a series of conditional checks:
* **Decision 1 (Right):** "Does rule and KB opinion agree?"
* **Yes:** Proceed to "Follow the rules."
* **No:** Proceed to "Is KB opinion positive?"
* **Decision 2 (Center):** "Is KB opinion positive?"
* **Yes:** Proceed to "Is $U_i >= T_{positive_i}$ AND $U_{other} >= T_{negative_{other}}$?"
* **No:** Proceed to "Is $U_i < T_{negative_i}$?"
* **Decision 3 (Bottom Center):** "Is $U_i >= T_{positive_i}$ AND $U_{other} >= T_{negative_{other}}$?"
* **Yes:** Proceed to "Is $R_{max} <= T_{risk}$?"
* **No:** Proceed to "Follow the rules."
* **Decision 4 (Top Left):** "Is $U_i < T_{negative_i}$?"
* **Yes:** Proceed to "Override the rules."
* **No:** Proceed to "Is $R_{max} > T_{risk}$?"
* **Decision 5 (Bottom Left):** "Is $R_{max} <= T_{risk}$?"
* **Yes:** Proceed to "Override the rules."
* **No:** Proceed to "Follow the rules."
* **Decision 6 (Top Left):** "Is $R_{max} > T_{risk}$?"
* **Yes:** Proceed to "Override the rules."
* **No:** Loop back to the start of the process (before the initialization blocks).
### Key Observations
* **The "Override" Path:** The system is designed to favor "Follow the rules" by default. An "Override" only occurs if the KB opinion is sufficiently strong (positive or negative) and the calculated risk ($R_{max}$) is within acceptable thresholds ($T_{risk}$).
* **The Loop:** There is a feedback loop. If the system reaches the "Is $R_{max} > T_{risk}$?" decision and the answer is "No," the process restarts, implying a continuous monitoring or re-evaluation cycle.
* **Mathematical Sensitivity:** The risk threshold $T_{risk}$ uses an exponential function ($e^{r/4.17}$), suggesting that risk tolerance is non-linear; small increases in $r$ (raw risk) will lead to larger increases in $T_{risk}$ as the value grows.
### Interpretation
This diagram represents a **Safety-Critical Decision Controller**.
The logic demonstrates a "Trust but Verify" approach to rule-following. The system assumes the rules are correct ("Follow the rules" is the default outcome). However, it allows for an "Override" if the Knowledge Base (KB) provides a conflicting opinion that is statistically significant (based on $U_i$ and $U_{other}$ thresholds) and if the associated risk ($R_{max}$) is deemed acceptable.
The inclusion of $T_{positive}$ and $T_{negative}$ suggests the system is balancing the utility of an action against the potential negative consequences. The loop back to the start indicates this is likely a real-time system that constantly re-evaluates the environment (Blackboard data) to see if the conditions for an override have changed.