\n
## Diagram: Decision Flow for Rule Override
### Overview
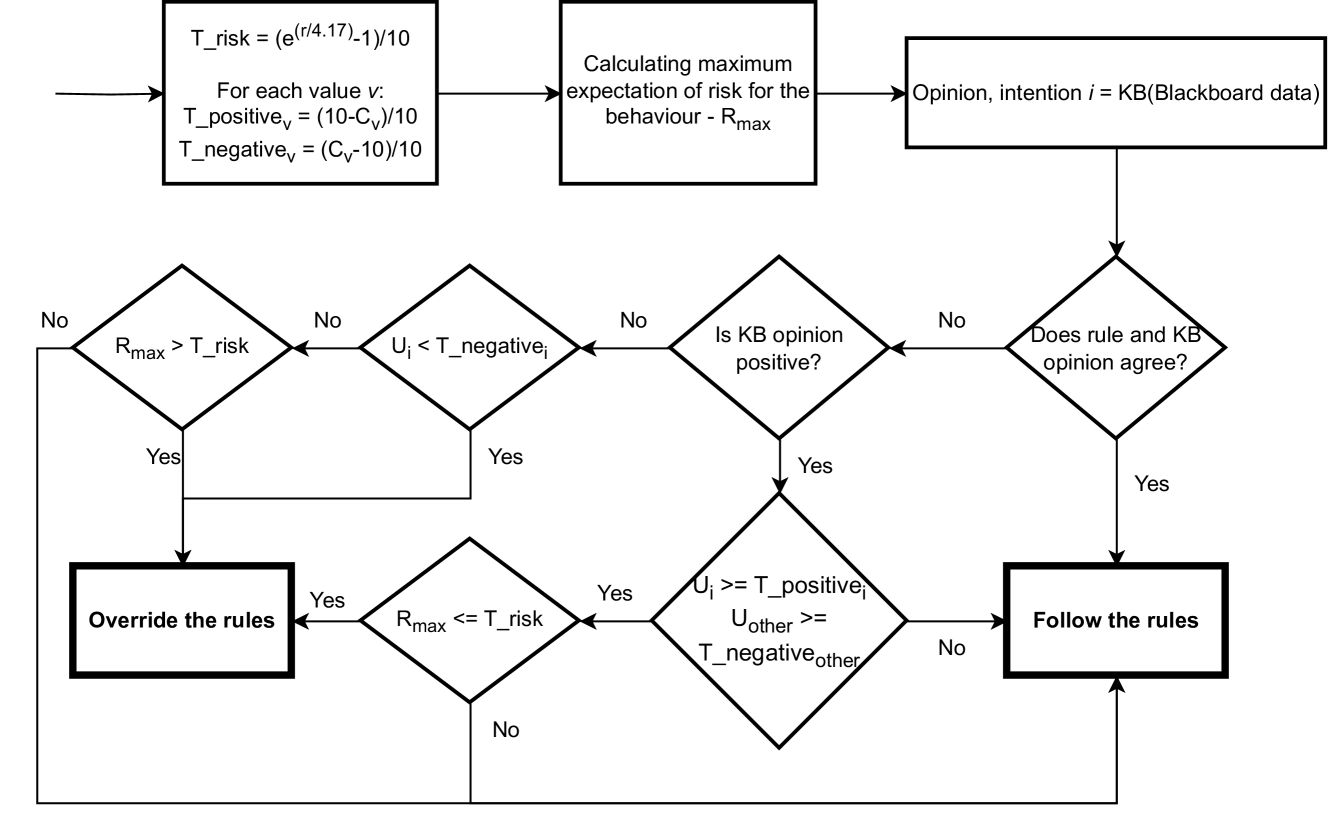
This diagram illustrates a decision-making process for overriding predefined rules based on risk assessment and knowledge base (KB) opinion. The flow chart uses diamond shapes to represent decision points, rectangles for actions, and arrows to indicate the direction of the process. The diagram begins with a calculation of risk thresholds and proceeds through a series of comparisons and evaluations to determine whether to override the rules or follow them.
### Components/Axes
The diagram consists of the following components:
* **Initial Calculation:** A formula for calculating risk thresholds (T\_risk, T\_positive, T\_negative).
* **Decision Diamonds:** Representing questions or conditions to be evaluated.
* **Action Rectangles:** Representing actions to be taken based on the decision outcomes.
* **Arrows:** Indicating the flow of the process.
* **Text Labels:** Describing the calculations, questions, and actions.
### Detailed Analysis or Content Details
The diagram's flow can be described as follows:
1. **Initial Calculation:**
* `T_risk = (e^(√ (4.17))-1)/10`
* `For each value v:`
* `T_positive_v = (10-C_v)/10`
* `T_negative_v = (C_v-10)/10`
2. **First Decision:** `Rmax > T_risk`
* **No:** Proceeds to the next decision.
* **Yes:** Action: "Override the rules".
3. **Second Decision:** `U_i < T_negative_i`
* **No:** Proceeds to the next decision.
* **Yes:** Proceeds to the next decision.
4. **Third Decision:** `Is KB opinion positive?`
* **No:** Proceeds to the next decision.
* **Yes:** Proceeds to the next decision.
5. **Fourth Decision:** `Does rule and KB opinion agree?`
* **No:** Proceeds to the next decision.
* **Yes:** Action: "Follow the rules".
6. **Fifth Decision (after Rmax > T_risk is Yes):** `Rmax <= T_risk`
* **No:** Returns to "Override the rules".
* **Yes:** Proceeds to the next decision.
7. **Sixth Decision (after Rmax <= T_risk is Yes):** `U_i >= T_positive_i` and `U_other >= T_negative_other`
* **No:** Returns to "Override the rules".
* **Yes:** Action: "Follow the rules".
The diagram also includes a box labeled "Calculating maximum expectation of risk for the behaviour - Rmax" and a box labeled "Opinion, intention i = KB(Blackboard data)".
### Key Observations
The diagram presents a hierarchical decision process. The initial calculation sets risk thresholds, and subsequent decisions refine whether to override the rules or adhere to them. The KB opinion and agreement between the rule and KB opinion play a crucial role in the final decision. The flow loops back to "Override the rules" under certain conditions, suggesting a cautious approach to rule adherence.
### Interpretation
This diagram likely represents a component of an intelligent system, such as a behavior-based robotics controller or an expert system. The system assesses the risk associated with a particular behavior (Rmax) and compares it to a pre-defined risk threshold (T\_risk). The KB opinion provides an additional layer of evaluation, potentially representing a higher-level understanding of the situation. The decision to override the rules suggests a mechanism for adapting to unforeseen circumstances or conflicting information. The use of thresholds (T\_positive, T\_negative) indicates a fuzzy logic or probabilistic approach to decision-making. The diagram highlights the importance of balancing pre-defined rules with real-time risk assessment and knowledge-based reasoning. The loop back to "Override the rules" suggests a safety mechanism, where the system prioritizes risk mitigation over strict rule adherence when necessary. The diagram is a visual representation of a complex decision-making algorithm, designed to ensure robust and adaptable behavior in a dynamic environment.