## Flowchart: Decision-Making Process for Rule Adherence
### Overview
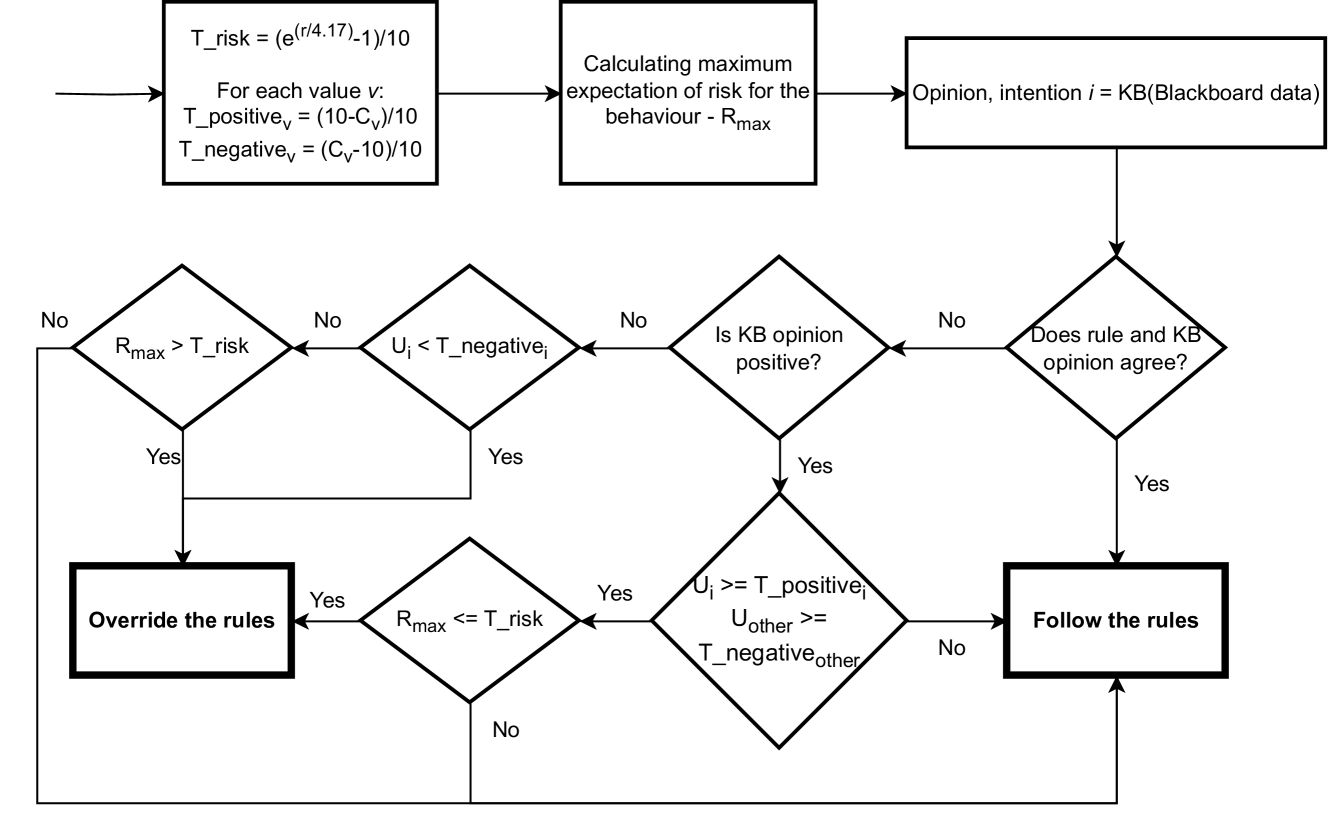
The flowchart outlines a structured decision-making process to determine whether to follow or override established rules based on risk assessment, opinion alignment, and behavioral expectations. It integrates mathematical risk calculations with qualitative opinion data (KB/Blackboard data) to guide outcomes.
---
### Components/Axes
1. **Process Boxes** (Rectangular):
- "Calculating maximum expectation of risk for the behaviour - R_max"
- "Override the rules"
- "Follow the rules"
2. **Decision Diamonds** (Rounded):
- "R_max > T_risk?"
- "U_i < T_negative_i?"
- "Is KB opinion positive?"
- "Does rule and KB opinion agree?"
- "R_max <= T_risk?"
- "U_i >= T_positive_i?"
3. **Formulas**:
- `T_risk = (e^(r/4.17) - 1)/10`
- For each value `v`:
- `T_positive_v = (10 - C_v)/10`
- `T_negative_v = (C_v - 10)/10`
---
### Detailed Analysis
1. **Risk Calculation**:
- `R_max` is computed first, representing the maximum expected risk for a behavior.
- Thresholds `T_positive_v` and `T_negative_v` are derived for each value `v` using `C_v` (likely a confidence or cost metric).
2. **Decision Flow**:
- **Path 1 (R_max > T_risk)**:
- If `U_i < T_negative_i`, proceed to check KB opinion positivity.
- If KB opinion is positive and aligns with rules, follow the rules.
- If opinions disagree, override rules if `R_max <= T_risk` and `U_other >= T_negative_other`.
- **Path 2 (R_max <= T_risk)**:
- If `U_i >= T_positive_i`, override rules if `U_other >= T_negative_other`.
- Otherwise, follow rules.
3. **Key Variables**:
- `U_i`: Likely represents utility or user-specific risk tolerance.
- `C_v`: Context-dependent variable influencing thresholds.
- `KB(Blackboard data)`: Expert or system-generated opinion data.
---
### Key Observations
- **Mathematical Rigor**: Risk thresholds (`T_risk`, `T_positive_v`, `T_negative_v`) are formula-driven, ensuring consistency.
- **Conditional Logic**: Decisions hinge on comparisons between `R_max`, `U_i`, and thresholds, with opinion alignment as a tiebreaker.
- **Dual Outcomes**: The process resolves into binary actions: "Override the rules" or "Follow the rules."
---
### Interpretation
This flowchart models a hybrid decision system where:
1. **Risk Assessment** quantifies behavioral risks using exponential decay (`e^(r/4.17)`), suggesting diminishing returns on risk tolerance with increasing `r`.
2. **Opinion Integration** (via KB/Blackboard data) introduces subjectivity, balancing quantitative risk with qualitative consensus.
3. **Rule Override Conditions**:
- High risk (`R_max > T_risk`) paired with low user tolerance (`U_i < T_negative_i`) and positive KB opinion may justify overriding rules.
- Low risk (`R_max <= T_risk`) with high user tolerance (`U_i >= T_positive_i`) and conflicting opinions may also trigger overrides.
4. **System Design**: The process prioritizes safety (`T_negative` thresholds) while allowing flexibility when opinions and risk metrics align.
The system appears designed for scenarios requiring both data-driven risk management and expert consensus, such as autonomous systems or policy enforcement frameworks.