## Diagram: Synaptic Regulation Network
### Overview
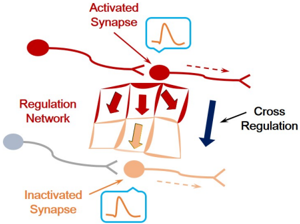
The diagram illustrates a synaptic regulation network involving activated and inactivated synapses, a central regulation network, and cross-regulation mechanisms. Key components include labeled synapses, directional arrows indicating interactions, and waveform annotations.
### Components/Axes
- **Activated Synapse**: Red-colored synapse with a waveform (orange line in blue speech bubble) positioned at the top-left.
- **Inactivated Synapse**: Orange-colored synapse with a waveform (orange line in blue speech bubble) at the bottom-left.
- **Regulation Network**: Central cube-like structure with bidirectional red arrows (input/output) and a single orange arrow (feedback).
- **Cross Regulation**: Blue dashed arrow connecting the activated synapse (top-right) to the inactivated synapse (bottom-right).
- **Legend**: Colors correspond to components: red (activated synapse), orange (inactivated synapse), blue (cross regulation), gray (unlabeled element).
### Detailed Analysis
1. **Activated Synapse**:
- Positioned at the top-left, emitting a waveform (orange line) labeled "Activated Synapse."
- Red arrows point from the synapse to the regulation network, indicating activation signals.
2. **Regulation Network**:
- Central cube with three red arrows (input) and one orange arrow (feedback).
- Arrows suggest bidirectional communication with the activated synapse and feedback to itself.
3. **Inactivated Synapse**:
- Located at the bottom-left, emitting a waveform (orange line) labeled "Inactivated Synapse."
- Orange arrow points from the regulation network to the synapse, indicating inhibitory regulation.
4. **Cross Regulation**:
- Blue dashed arrow connects the activated synapse (top-right) to the inactivated synapse (bottom-right), suggesting reciprocal modulation.
### Key Observations
- **Bidirectional Flow**: The regulation network receives input from the activated synapse and provides feedback, while also regulating the inactivated synapse.
- **Color Coding**: Red/orange arrows denote activation/inhibition, while blue represents cross-regulation.
- **Waveforms**: Both synapses have identical waveform annotations, implying similar signal characteristics despite activation states.
### Interpretation
The diagram models a regulatory system where:
1. **Activated synapses** drive network activity and self-regulation.
2. **Inactivated synapses** are modulated by the network, potentially stabilizing activity.
3. **Cross-regulation** introduces feedback between activation states, enabling dynamic balance.
4. The absence of numerical data suggests a conceptual framework rather than quantitative analysis. The waveforms may represent action potentials or neurotransmitter release patterns, though this is speculative without explicit labels.
This network could represent neuromodulatory processes, such as synaptic plasticity or homeostatic regulation, where cross-talk between activation states maintains cellular equilibrium.