## Heatmap: MIND - Short-to-Long - Qwen-2.5 3B
### Overview
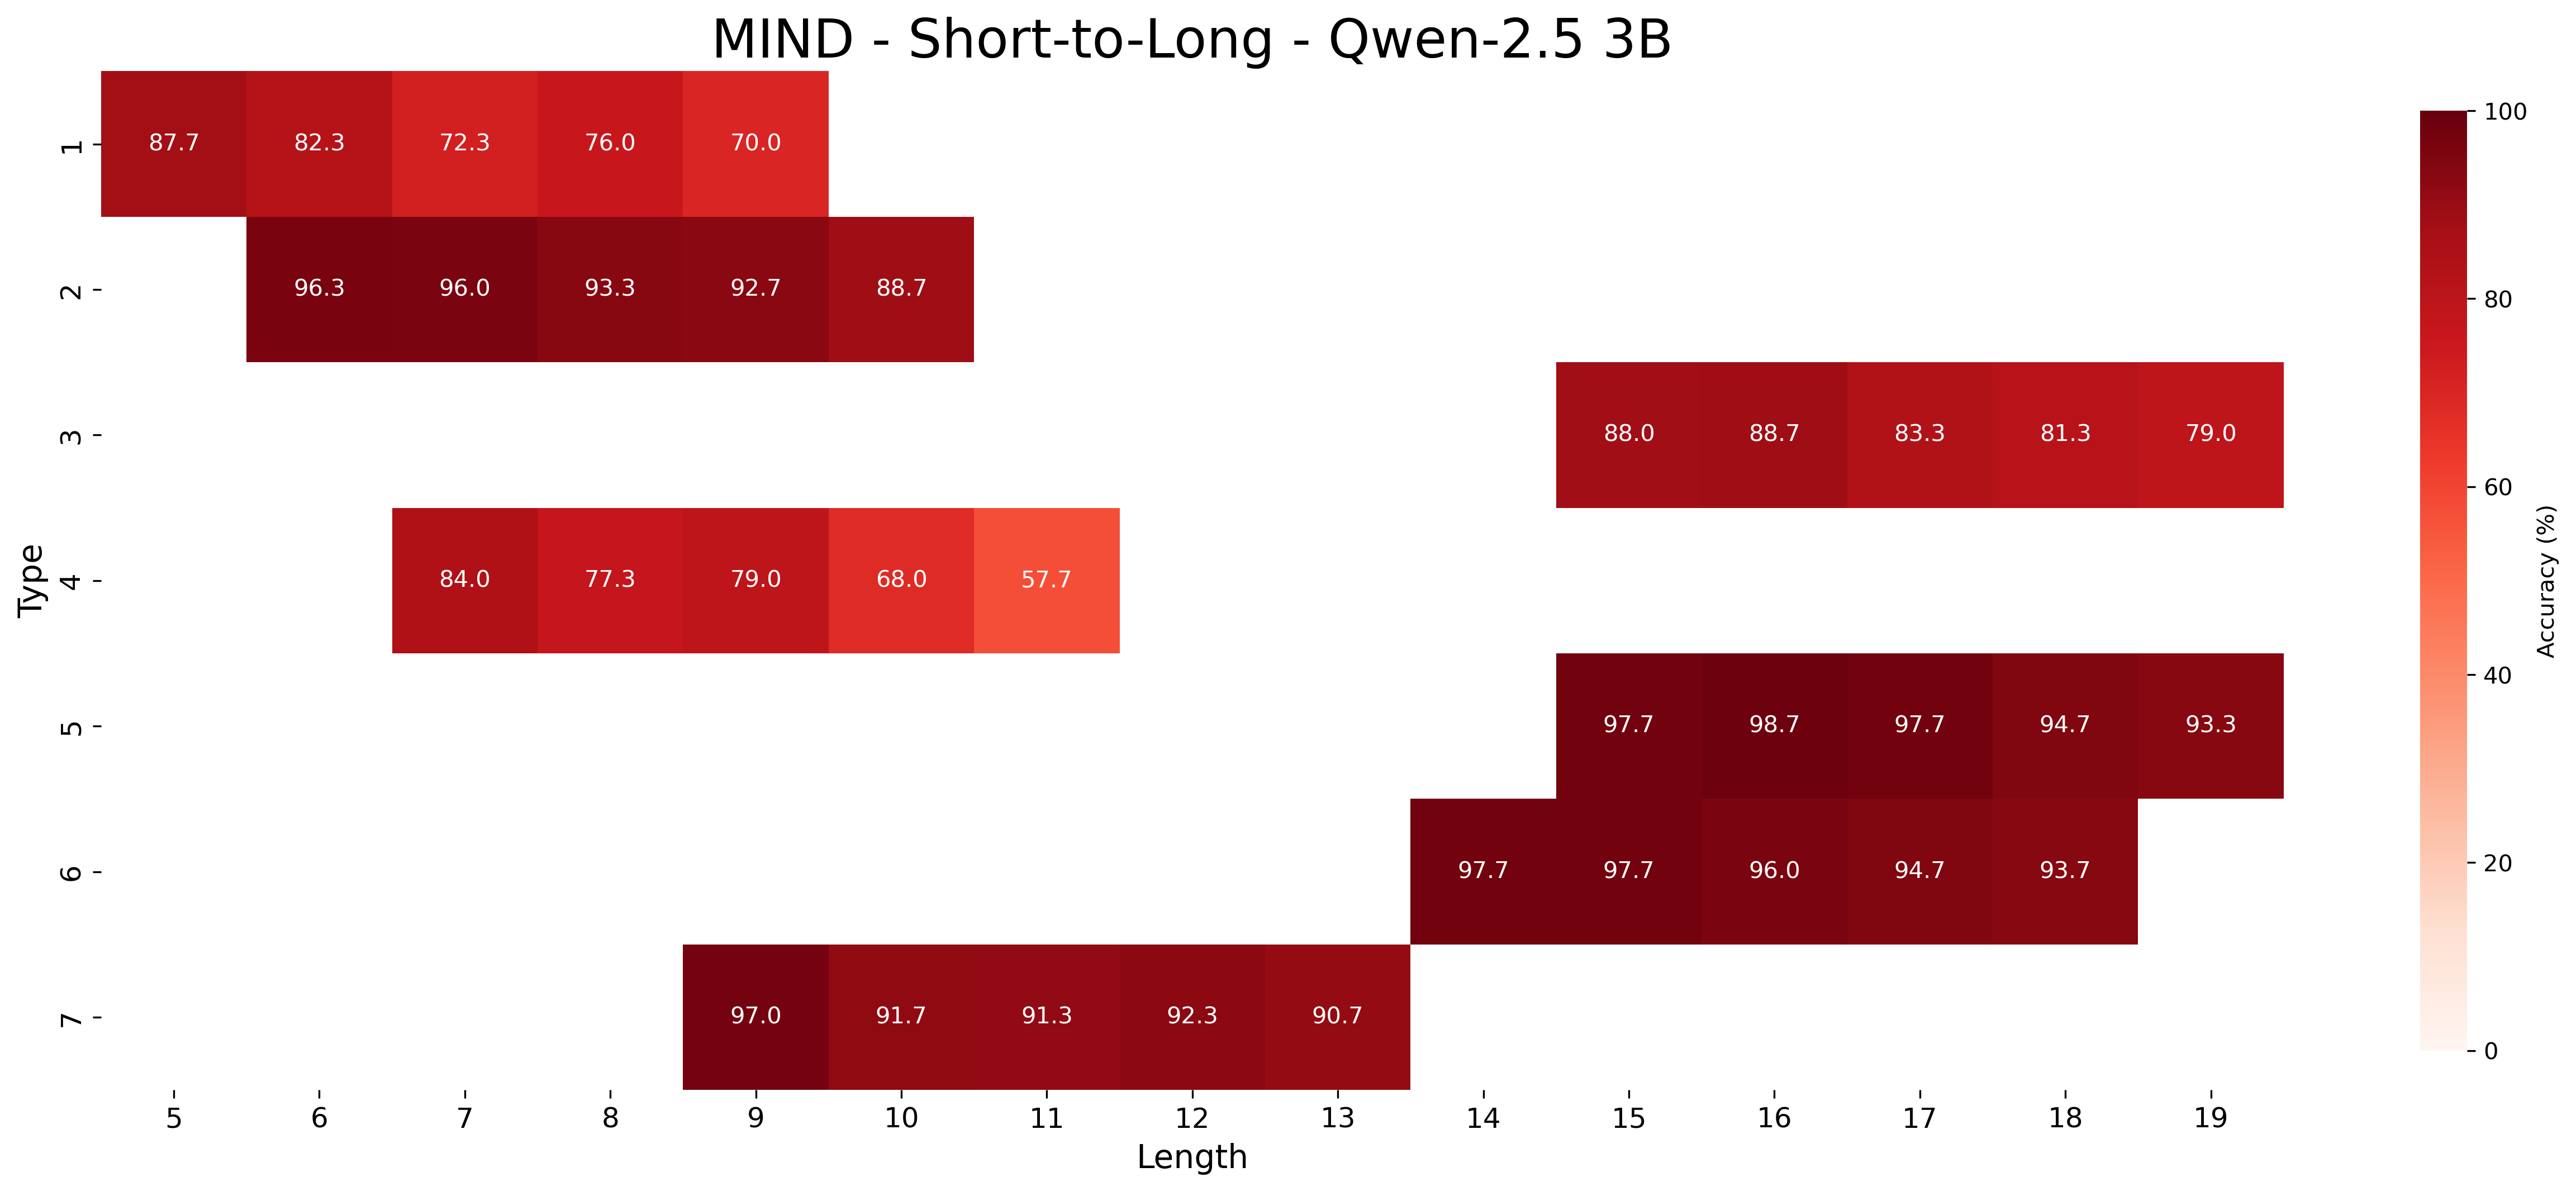
The image is a heatmap titled "MIND - Short-to-Long - Qwen-2.5 3B". It visualizes accuracy percentages for different "Types" across varying "Length" values. The heatmap uses a color gradient from white to dark red, where darker shades of red indicate higher accuracy.
### Components/Axes
* **Title:** MIND - Short-to-Long - Qwen-2.5 3B
* **Y-axis:** "Type" with values 1 to 7.
* **X-axis:** "Length" with values 5 to 19.
* **Color Scale:** Represents "Accuracy (%)" ranging from 0 to 100, with white indicating 0% and dark red indicating 100%. The color bar is located on the right side of the heatmap.
### Detailed Analysis
The heatmap displays accuracy values for different combinations of "Type" and "Length". Each cell in the heatmap contains a numerical value representing the accuracy percentage.
**Type 1:**
* Length 5: 87.7%
* Length 6: 82.3%
* Length 7: 72.3%
* Length 8: 76.0%
* Length 9: 70.0%
* Trend: Accuracy decreases as length increases.
**Type 2:**
* Length 6: 96.3%
* Length 7: 96.0%
* Length 8: 93.3%
* Length 9: 92.7%
* Length 10: 88.7%
* Trend: Accuracy decreases as length increases.
**Type 3:**
* Length 14: 88.0%
* Length 15: 88.7%
* Length 16: 83.3%
* Length 17: 81.3%
* Length 18: 79.0%
* Trend: Accuracy decreases as length increases.
**Type 4:**
* Length 7: 84.0%
* Length 8: 77.3%
* Length 9: 79.0%
* Length 10: 68.0%
* Length 11: 57.7%
* Trend: Accuracy decreases as length increases.
**Type 5:**
* Length 14: 97.7%
* Length 15: 98.7%
* Length 16: 97.7%
* Length 17: 94.7%
* Length 18: 93.3%
* Trend: Accuracy decreases as length increases.
**Type 6:**
* Length 14: 97.7%
* Length 15: 97.7%
* Length 16: 96.0%
* Length 17: 94.7%
* Length 18: 93.7%
* Trend: Accuracy decreases as length increases.
**Type 7:**
* Length 9: 97.0%
* Length 10: 91.7%
* Length 11: 91.3%
* Length 12: 92.3%
* Length 13: 90.7%
* Trend: Accuracy decreases as length increases.
### Key Observations
* Accuracy values generally range from approximately 57.7% to 98.7%.
* Types 5 and 6 show the highest accuracy values overall.
* Type 4 shows the lowest accuracy values overall.
* For most types, accuracy tends to decrease as the length increases.
### Interpretation
The heatmap visualizes the performance of the "Qwen-2.5 3B" model on the "MIND - Short-to-Long" task. The "Type" likely represents different categories or configurations within the task, while "Length" represents the input sequence length. The accuracy values indicate how well the model performs for each combination of type and length. The general trend of decreasing accuracy with increasing length suggests that the model may struggle with longer sequences. The differences in accuracy across types suggest that the model's performance is also influenced by the specific characteristics of each type. Types 5 and 6 are the most robust, while Type 4 is the least.