## Heatmap: MIND - Short-to-Long - Qwen-2.5 3B
### Overview
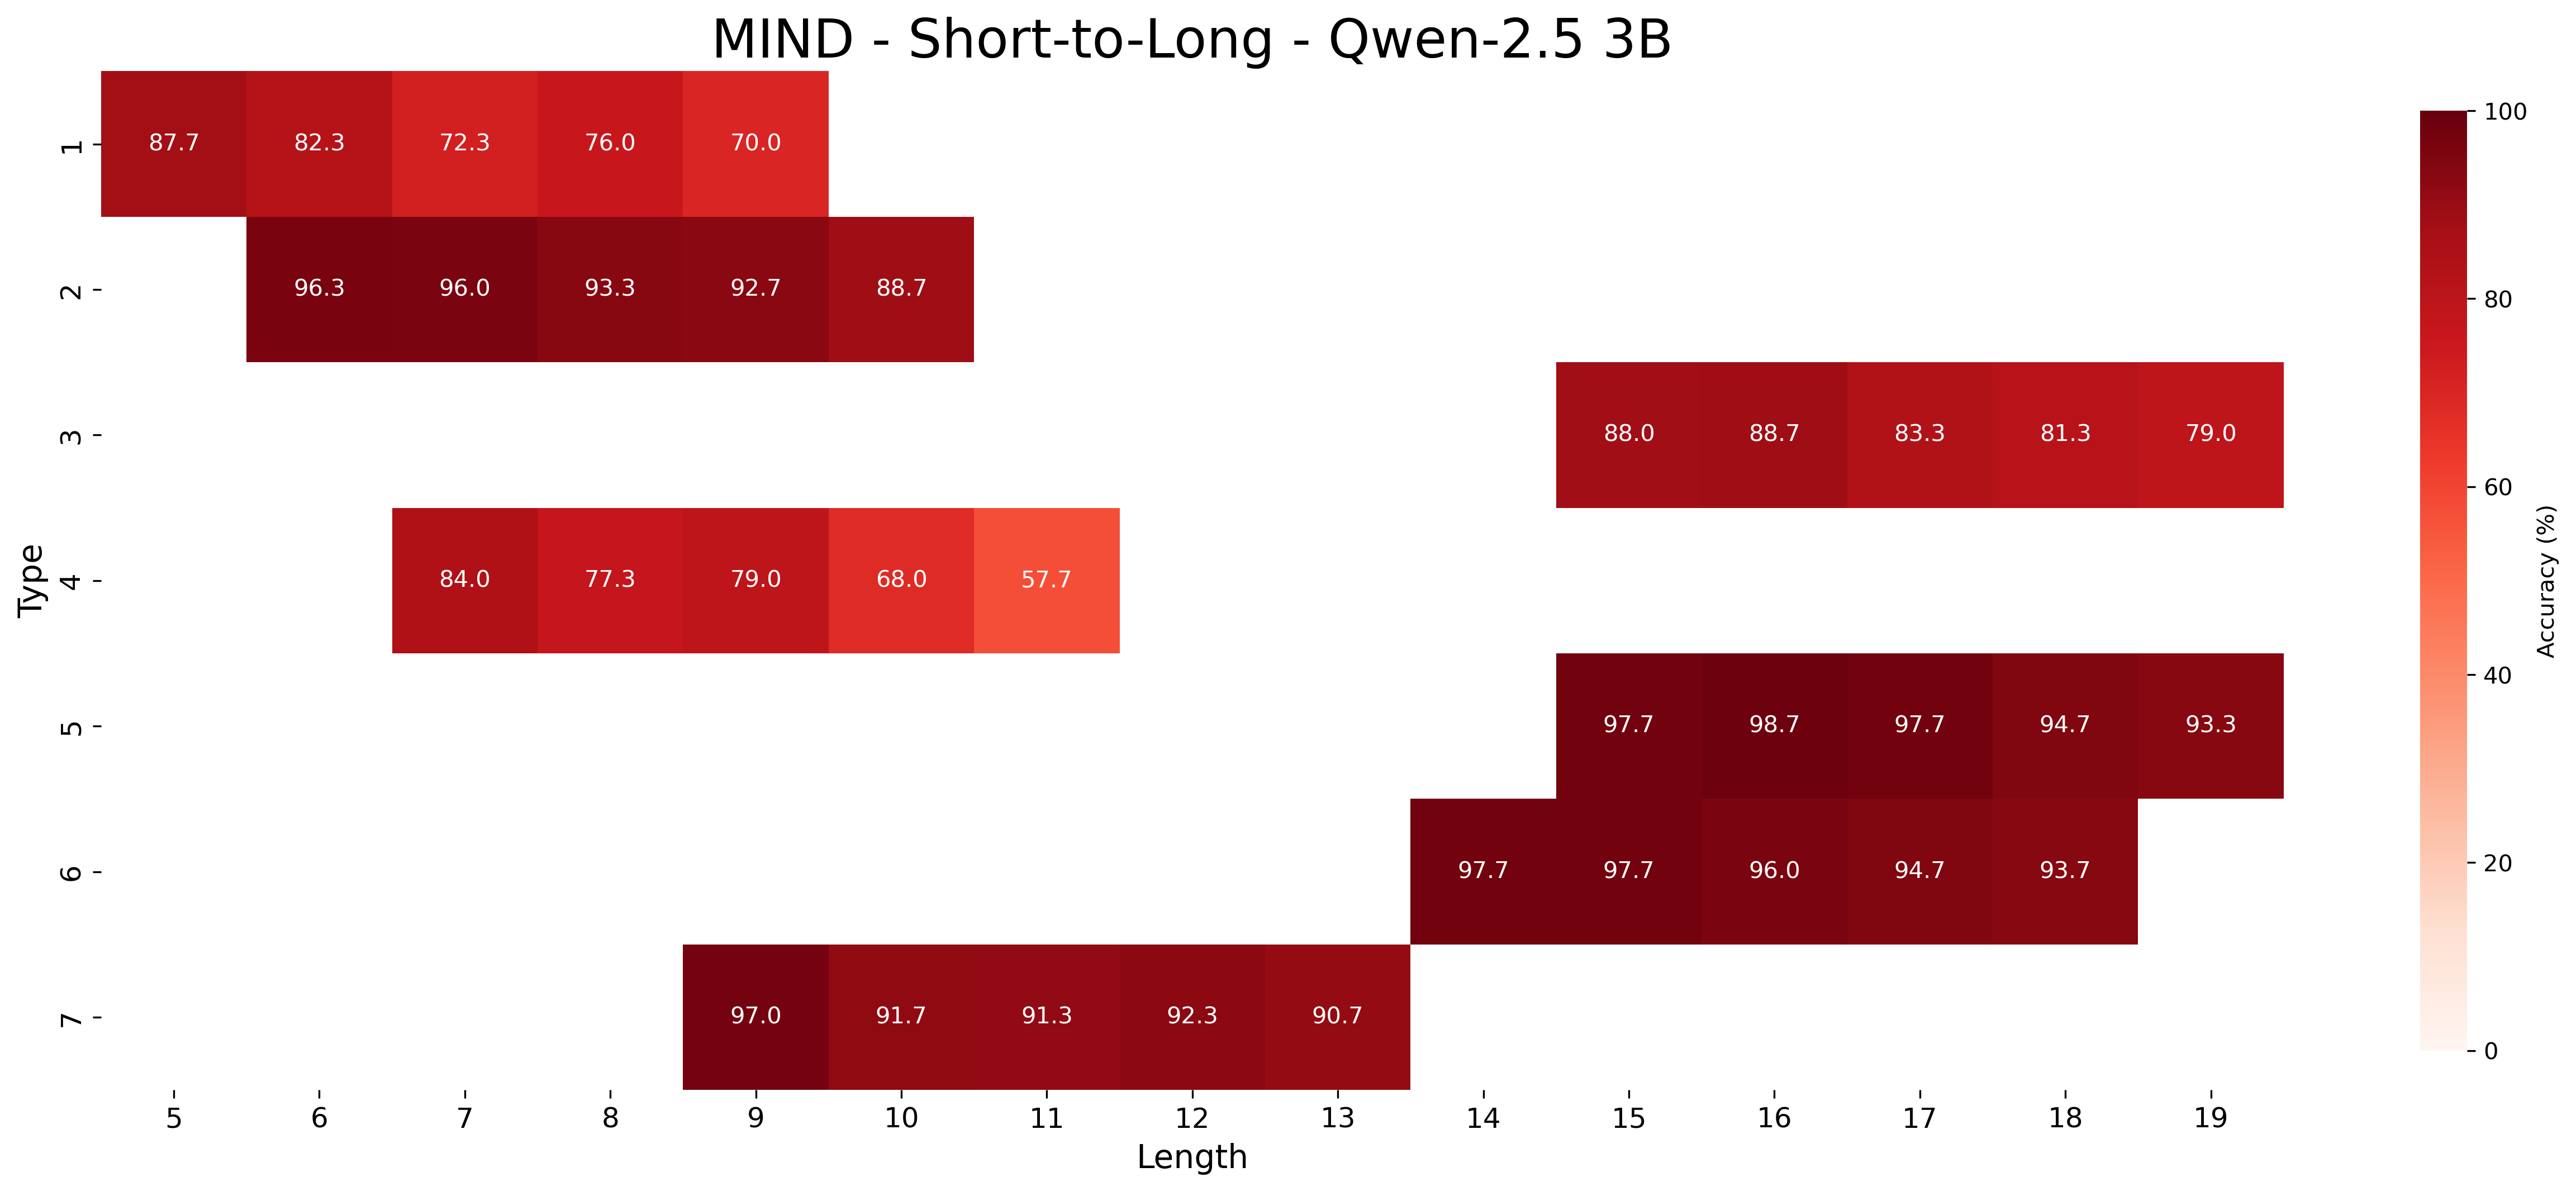
This image presents a heatmap visualizing the accuracy of a model (Qwen-2.5 3B) on the MIND dataset for short-to-long text generation, categorized by 'Type' and 'Length'. The heatmap uses a color gradient to represent accuracy, ranging from approximately 0% (lightest color) to 100% (darkest color).
### Components/Axes
* **Title:** MIND - Short-to-Long - Qwen-2.5 3B (Top-center)
* **X-axis:** Length, ranging from 5 to 19, with markers at each integer value. (Bottom)
* **Y-axis:** Type, ranging from 1 to 7, with markers at each integer value. (Left)
* **Colorbar:** Labeled "Accuracy (%)", ranging from 0 to 100, positioned on the right side of the heatmap. The color gradient transitions from light red/white to dark red.
### Detailed Analysis
The heatmap displays accuracy values for each combination of 'Type' and 'Length'. Here's a breakdown of the data, reading row by row (Type 1 to Type 7):
* **Type 1:**
* Length 5: 87.7%
* Length 6: 82.3%
* Length 7: 76.0%
* Length 8: 70.0%
* **Type 2:**
* Length 5: 96.3%
* Length 6: 96.0%
* Length 7: 93.3%
* Length 8: 92.7%
* Length 9: 88.7%
* **Type 3:**
* Length 8: 84.0%
* Length 9: 77.3%
* Length 10: 79.0%
* Length 11: 68.0%
* Length 12: 57.7%
* **Type 4:**
* Length 9: 84.0%
* Length 10: 77.3%
* Length 11: 79.0%
* Length 12: 68.0%
* Length 13: 57.7%
* **Type 5:**
* Length 13: 97.7%
* Length 14: 97.8%
* Length 15: 97.7%
* Length 16: 94.7%
* Length 17: 93.3%
* **Type 6:**
* Length 13: 97.7%
* Length 14: 96.7%
* Length 15: 96.0%
* Length 16: 94.7%
* Length 17: 93.7%
* **Type 7:**
* Length 9: 97.0%
* Length 10: 91.7%
* Length 11: 91.3%
* Length 12: 92.3%
* Length 13: 90.7%
**Trends:**
* For Types 1 and 2, accuracy generally decreases as length increases.
* For Type 3 and 4, accuracy decreases as length increases.
* For Types 5, 6, and 7, accuracy is generally high and remains relatively stable across lengths 13-17.
### Key Observations
* Type 2 consistently exhibits the highest accuracy across shorter lengths (5-8).
* Type 3 and 4 show the lowest accuracy values, particularly at longer lengths (11-12).
* Types 5, 6, and 7 demonstrate high accuracy for lengths 13 and above.
* There's a clear shift in performance based on length, with shorter lengths generally performing better for Types 1 and 2, and longer lengths performing well for Types 5, 6, and 7.
### Interpretation
The heatmap suggests that the Qwen-2.5 3B model performs differently depending on the 'Type' of text and its 'Length'. The 'Type' likely represents different categories or characteristics of the text within the MIND dataset. The model appears to be more effective at generating shorter texts for Types 1 and 2, while it excels at longer texts for Types 5, 6, and 7. The lower accuracy for Types 3 and 4 across all lengths indicates a potential weakness in handling those specific text types.
The data suggests that the model's performance is not uniform across all text characteristics. This could be due to variations in the training data distribution, the complexity of different text types, or the model's inherent biases. Further investigation into the nature of each 'Type' within the MIND dataset is needed to understand these performance differences. The heatmap provides a valuable visual summary of the model's strengths and weaknesses, guiding future development and optimization efforts.