## Diagram: State Transition Diagrams for RM (Resource Machines)
### Overview
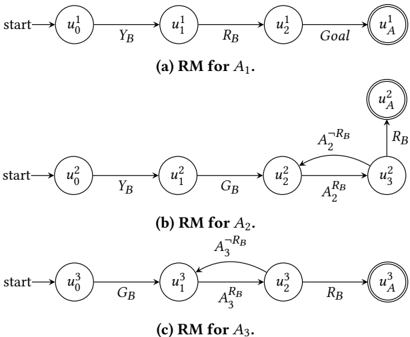
The image presents three state transition diagrams, labeled (a), (b), and (c), representing Resource Machines (RM) for agents A1, A2, and A3, respectively. Each diagram illustrates the possible states of the agent and the transitions between them, triggered by specific events or conditions. The diagrams use circles to represent states, arrows to represent transitions, and labels to indicate the events or conditions causing the transitions. Start states are indicated by an arrow pointing into the initial state, and goal states are indicated by a double circle.
### Components/Axes
* **States:** Represented by circles labeled as u<sub>i</sub><sup>j</sup>, where 'i' is the state number and 'j' is the agent number.
* **Transitions:** Represented by arrows between states, labeled with the event or condition that triggers the transition (e.g., Y<sub>B</sub>, R<sub>B</sub>, G<sub>B</sub>, A<sub>2</sub><sup>¬R<sub>B</sub></sup>, A<sub>2</sub><sup>R<sub>B</sub></sup>, A<sub>3</sub><sup>¬R<sub>B</sub></sup>, A<sub>3</sub><sup>R<sub>B</sub></sup>).
* **Start State:** Indicated by an arrow labeled "start" pointing to the initial state.
* **Goal State:** Indicated by a double circle around the state.
* **Labels:**
* (a) RM for A<sub>1</sub>.
* (b) RM for A<sub>2</sub>.
* (c) RM for A<sub>3</sub>.
### Detailed Analysis
**(a) RM for A<sub>1</sub>:**
* **States:** u<sub>0</sub><sup>1</sup>, u<sub>1</sub><sup>1</sup>, u<sub>2</sub><sup>1</sup>, u<sub>A</sub><sup>1</sup> (Goal State)
* **Transitions:**
* start → u<sub>0</sub><sup>1</sup>
* u<sub>0</sub><sup>1</sup> → u<sub>1</sub><sup>1</sup> labeled Y<sub>B</sub>
* u<sub>1</sub><sup>1</sup> → u<sub>2</sub><sup>1</sup> labeled R<sub>B</sub>
* u<sub>2</sub><sup>1</sup> → u<sub>A</sub><sup>1</sup> labeled Goal
**(b) RM for A<sub>2</sub>:**
* **States:** u<sub>0</sub><sup>2</sup>, u<sub>1</sub><sup>2</sup>, u<sub>2</sub><sup>2</sup>, u<sub>3</sub><sup>2</sup>, u<sub>A</sub><sup>2</sup> (Goal State)
* **Transitions:**
* start → u<sub>0</sub><sup>2</sup>
* u<sub>0</sub><sup>2</sup> → u<sub>1</sub><sup>2</sup> labeled Y<sub>B</sub>
* u<sub>1</sub><sup>2</sup> → u<sub>2</sub><sup>2</sup> labeled G<sub>B</sub>
* u<sub>2</sub><sup>2</sup> → u<sub>3</sub><sup>2</sup> labeled A<sub>2</sub><sup>R<sub>B</sub></sup>
* u<sub>3</sub><sup>2</sup> → u<sub>2</sub><sup>2</sup> labeled A<sub>2</sub><sup>¬R<sub>B</sub></sup>
* u<sub>3</sub><sup>2</sup> → u<sub>A</sub><sup>2</sup> labeled R<sub>B</sub>
**(c) RM for A<sub>3</sub>:**
* **States:** u<sub>0</sub><sup>3</sup>, u<sub>1</sub><sup>3</sup>, u<sub>2</sub><sup>3</sup>, u<sub>A</sub><sup>3</sup> (Goal State)
* **Transitions:**
* start → u<sub>0</sub><sup>3</sup>
* u<sub>0</sub><sup>3</sup> → u<sub>1</sub><sup>3</sup> labeled G<sub>B</sub>
* u<sub>1</sub><sup>3</sup> → u<sub>2</sub><sup>3</sup> labeled A<sub>3</sub><sup>R<sub>B</sub></sup>
* u<sub>2</sub><sup>3</sup> → u<sub>1</sub><sup>3</sup> labeled A<sub>3</sub><sup>¬R<sub>B</sub></sup>
* u<sub>2</sub><sup>3</sup> → u<sub>A</sub><sup>3</sup> labeled R<sub>B</sub>
### Key Observations
* Agent A<sub>1</sub> has a linear path to the goal state.
* Agents A<sub>2</sub> and A<sub>3</sub> have loops in their state transitions, indicating the possibility of returning to previous states based on certain conditions.
* The transitions are labeled with events involving 'B' (Y<sub>B</sub>, R<sub>B</sub>, G<sub>B</sub>) and actions of other agents (A<sub>2</sub>, A<sub>3</sub>) conditioned on the presence or absence of R<sub>B</sub> (A<sub>2</sub><sup>R<sub>B</sub></sup>, A<sub>2</sub><sup>¬R<sub>B</sub></sup>, A<sub>3</sub><sup>R<sub>B</sub></sup>, A<sub>3</sub><sup>¬R<sub>B</sub></sup>).
### Interpretation
The diagrams represent the possible behaviors of three agents (A<sub>1</sub>, A<sub>2</sub>, A<sub>3</sub>) in a system. The transitions between states are triggered by events or actions, potentially involving another entity 'B'. The loops in the state transition diagrams for A<sub>2</sub> and A<sub>3</sub> suggest that these agents can react to changes in the environment or the actions of other agents, allowing them to adapt their behavior. Agent A<sub>1</sub>, on the other hand, follows a fixed sequence of actions to reach its goal. The superscripts on the transition labels (e.g., A<sub>2</sub><sup>R<sub>B</sub></sup>) indicate that the action of agent A<sub>2</sub> is conditional on the presence or absence of R<sub>B</sub>. The diagrams provide a visual representation of the agents' decision-making processes and their interactions with the environment.