\n
## Diagram: Reactive Maps (RM) for Agents A1, A2, and A3
### Overview
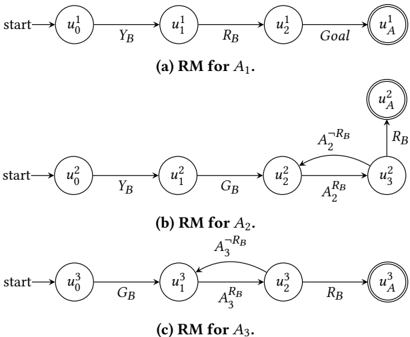
The image presents three separate reactive maps (RM) for three agents: A1, A2, and A3. Each map is a directed graph illustrating the agent's possible states and transitions based on environmental perceptions. The maps show the progression from a "start" state to a "Goal" state, with intermediate states labeled u0, u1, u2, and uA (superscripted with the agent number). Arrows indicate transitions triggered by specific conditions denoted by symbols like YB, RB, GB, A~RB, and A2RB, A3RB.
### Components/Axes
Each reactive map consists of:
* **States:** Represented by circles labeled u0, u1, u2, and uA (with agent-specific superscripts).
* **Transitions:** Represented by directed arrows connecting states.
* **Transition Conditions:** Labels on the arrows indicating the conditions that trigger the transition. These include:
* YB (approximately 0.75 times the length of the arrow)
* RB (approximately 0.75 times the length of the arrow)
* GB (approximately 0.75 times the length of the arrow)
* A~RB (approximately 0.75 times the length of the arrow)
* A2RB (approximately 0.75 times the length of the arrow)
* A3RB (approximately 0.75 times the length of the arrow)
* **Start State:** Labeled "start" and is the initial state of each map.
* **Goal State:** Labeled "Goal" (for A1) or uA (superscripted with the agent number) and represents the desired outcome.
* **Map Labels:** Each map is labeled (a) RM for A1, (b) RM for A2, and (c) RM for A3.
### Detailed Analysis / Content Details
**Map (a) - RM for A1:**
* Start -> u0¹ (transition: YB)
* u0¹ -> u1¹ (transition: YB)
* u1¹ -> u2¹ (transition: RB)
* u2¹ -> uA¹ (transition: Goal)
* uA¹ -> uA² (transition: RB)
**Map (b) - RM for A2:**
* Start -> u0² (transition: YB)
* u0² -> u1² (transition: YB)
* u1² -> u2² (transition: GB)
* u2² -> u3² (transition: A2RB)
* u2² -> u3² (transition: A~RB)
* u3² -> uA² (transition: RB)
**Map (c) - RM for A3:**
* Start -> u0³ (transition: GB)
* u0³ -> u1³ (transition: GB)
* u1³ -> u2³ (transition: A3RB)
* u2³ -> uA³ (transition: RB)
### Key Observations
* All three maps start with a transition triggered by either YB or GB.
* Map A2 has a branching transition from u2² to u3², triggered by both A2RB and A~RB. This indicates a decision point based on the presence or absence of RB.
* The maps differ in the sequence of transitions and the conditions that trigger them, reflecting the unique reactive behavior of each agent.
* The goal state is reached via a transition triggered by RB in maps A1 and A3, and by RB in map A2.
### Interpretation
These reactive maps represent simplified models of agent behavior in a dynamic environment. Each agent reacts to specific perceptual inputs (YB, RB, GB, A~RB, A2RB, A3RB) by transitioning between states. The maps illustrate how different agents can have different responses to the same environmental conditions.
The branching transition in Map A2 suggests that the agent needs to make a decision based on whether RB is present or absent. The use of A~RB (A not RB) indicates a negation condition.
The maps are a visual representation of a state machine, where each state represents a possible situation the agent can be in, and the transitions represent the actions the agent takes based on its perceptions. The maps are useful for understanding the basic reactive capabilities of each agent and for designing more complex behaviors. The maps are not quantitative, but rather qualitative representations of agent behavior. They do not provide information about the timing or duration of transitions. They also do not account for uncertainty or noise in the perceptual inputs.