\n
## Bar Chart: Consistency of AI Model Answers Under Original vs. Typo Conditions
### Overview
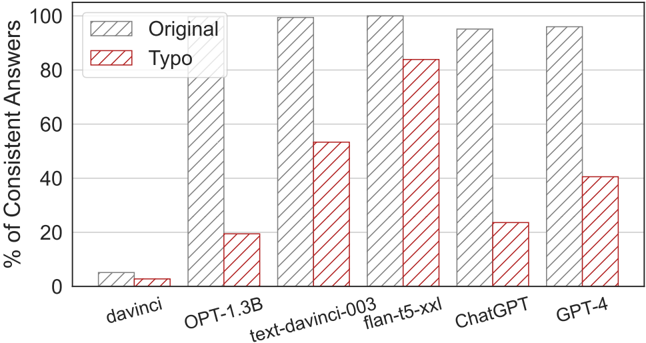
This is a grouped bar chart comparing the performance of six different large language models (LLMs) on a task. The performance metric is the percentage of consistent answers given by each model. For each model, two conditions are tested: the "Original" input and a "Typo" version of the input. The chart visually demonstrates how the introduction of typos affects the consistency of each model's outputs.
### Components/Axes
* **Chart Type:** Grouped bar chart.
* **Y-Axis:** Labeled "% of Consistent Answers". The scale runs from 0 to 100 in increments of 20 (0, 20, 40, 60, 80, 100).
* **X-Axis:** Lists six AI models. From left to right: `davinci`, `OPT-1.3B`, `text-davinci-003`, `flan-t5-xxl`, `ChatGPT`, `GPT-4`.
* **Legend:** Located in the top-left corner of the plot area.
* A gray, diagonally hatched bar (///) represents the **"Original"** condition.
* A red, diagonally hatched bar (///) represents the **"Typo"** condition.
* **Data Series:** Two bars are grouped for each model on the x-axis. The left bar (gray) is for "Original", and the right bar (red) is for "Typo".
### Detailed Analysis
**Trend Verification:** For every model, the "Original" bar (gray) is taller than the corresponding "Typo" bar (red). This indicates a universal trend: the consistency of answers decreases when typos are introduced into the input.
**Data Point Extraction (Approximate Values):**
1. **davinci**
* Original: ~5%
* Typo: ~3%
* *Observation:* Both values are very low, indicating poor consistency overall. The drop due to typos is minimal in absolute terms.
2. **OPT-1.3B**
* Original: ~78%
* Typo: ~20%
* *Observation:* Shows a dramatic drop of approximately 58 percentage points. This model is highly sensitive to typos.
3. **text-davinci-003**
* Original: ~100% (appears to hit the top of the chart)
* Typo: ~54%
* *Observation:* Near-perfect consistency on original text, but drops by nearly half when typos are present.
4. **flan-t5-xxl**
* Original: ~100%
* Typo: ~84%
* *Observation:* Also shows near-perfect original consistency. It demonstrates the highest robustness to typos among all models, with only a ~16 percentage point drop.
5. **ChatGPT**
* Original: ~95%
* Typo: ~24%
* *Observation:* High original consistency, but suffers a severe drop of approximately 71 percentage points, making it the most sensitive model to typos in this comparison.
6. **GPT-4**
* Original: ~96%
* Typo: ~41%
* *Observation:* High original consistency. The drop due to typos (~55 points) is significant but less severe than ChatGPT or OPT-1.3B.
### Key Observations
* **Performance Hierarchy (Original):** `text-davinci-003` and `flan-t5-xxl` are tied for the highest consistency (~100%), followed closely by `GPT-4` and `ChatGPT` (~95-96%). `OPT-1.3B` is notably lower (~78%), and `davinci` performs very poorly (~5%).
* **Robustness Hierarchy (Typo Impact):** `flan-t5-xxl` is the most robust, retaining ~84% consistency. `text-davinci-003` is next (~54%). `GPT-4` (~41%), `ChatGPT` (~24%), and `OPT-1.3B` (~20%) show poor robustness. `davinci`'s low baseline makes its drop less meaningful.
* **Largest Absolute Drop:** `ChatGPT` shows the largest decrease in consistency (~71 points).
* **Smallest Absolute Drop (among high performers):** `flan-t5-xxl` shows the smallest decrease (~16 points).
### Interpretation
The data suggests a critical vulnerability in many state-of-the-art LLMs: their output consistency is highly dependent on perfectly spelled input. While models like `text-davinci-003` and `flan-t5-xxl` achieve near-perfect reliability on clean text, their performance can degrade substantially—by half or more—when faced with simple typographical errors.
The stark contrast between `flan-t5-xxl` (robust) and `ChatGPT`/`OPT-1.3B` (fragile) is particularly noteworthy. It implies that architectural differences, training data, or fine-tuning objectives can create vastly different levels of resilience to noisy input. For real-world applications where user input is rarely perfect, this robustness is arguably as important as peak performance on clean data. The chart argues that evaluating models solely on "Original" conditions provides an incomplete and potentially misleading picture of their practical utility. The outlier performance of `flan-t5-xxl` demonstrates that high consistency and high robustness can coexist, setting a benchmark for future model development.