## Bar Chart: Count of Papers Published Per Year
### Overview
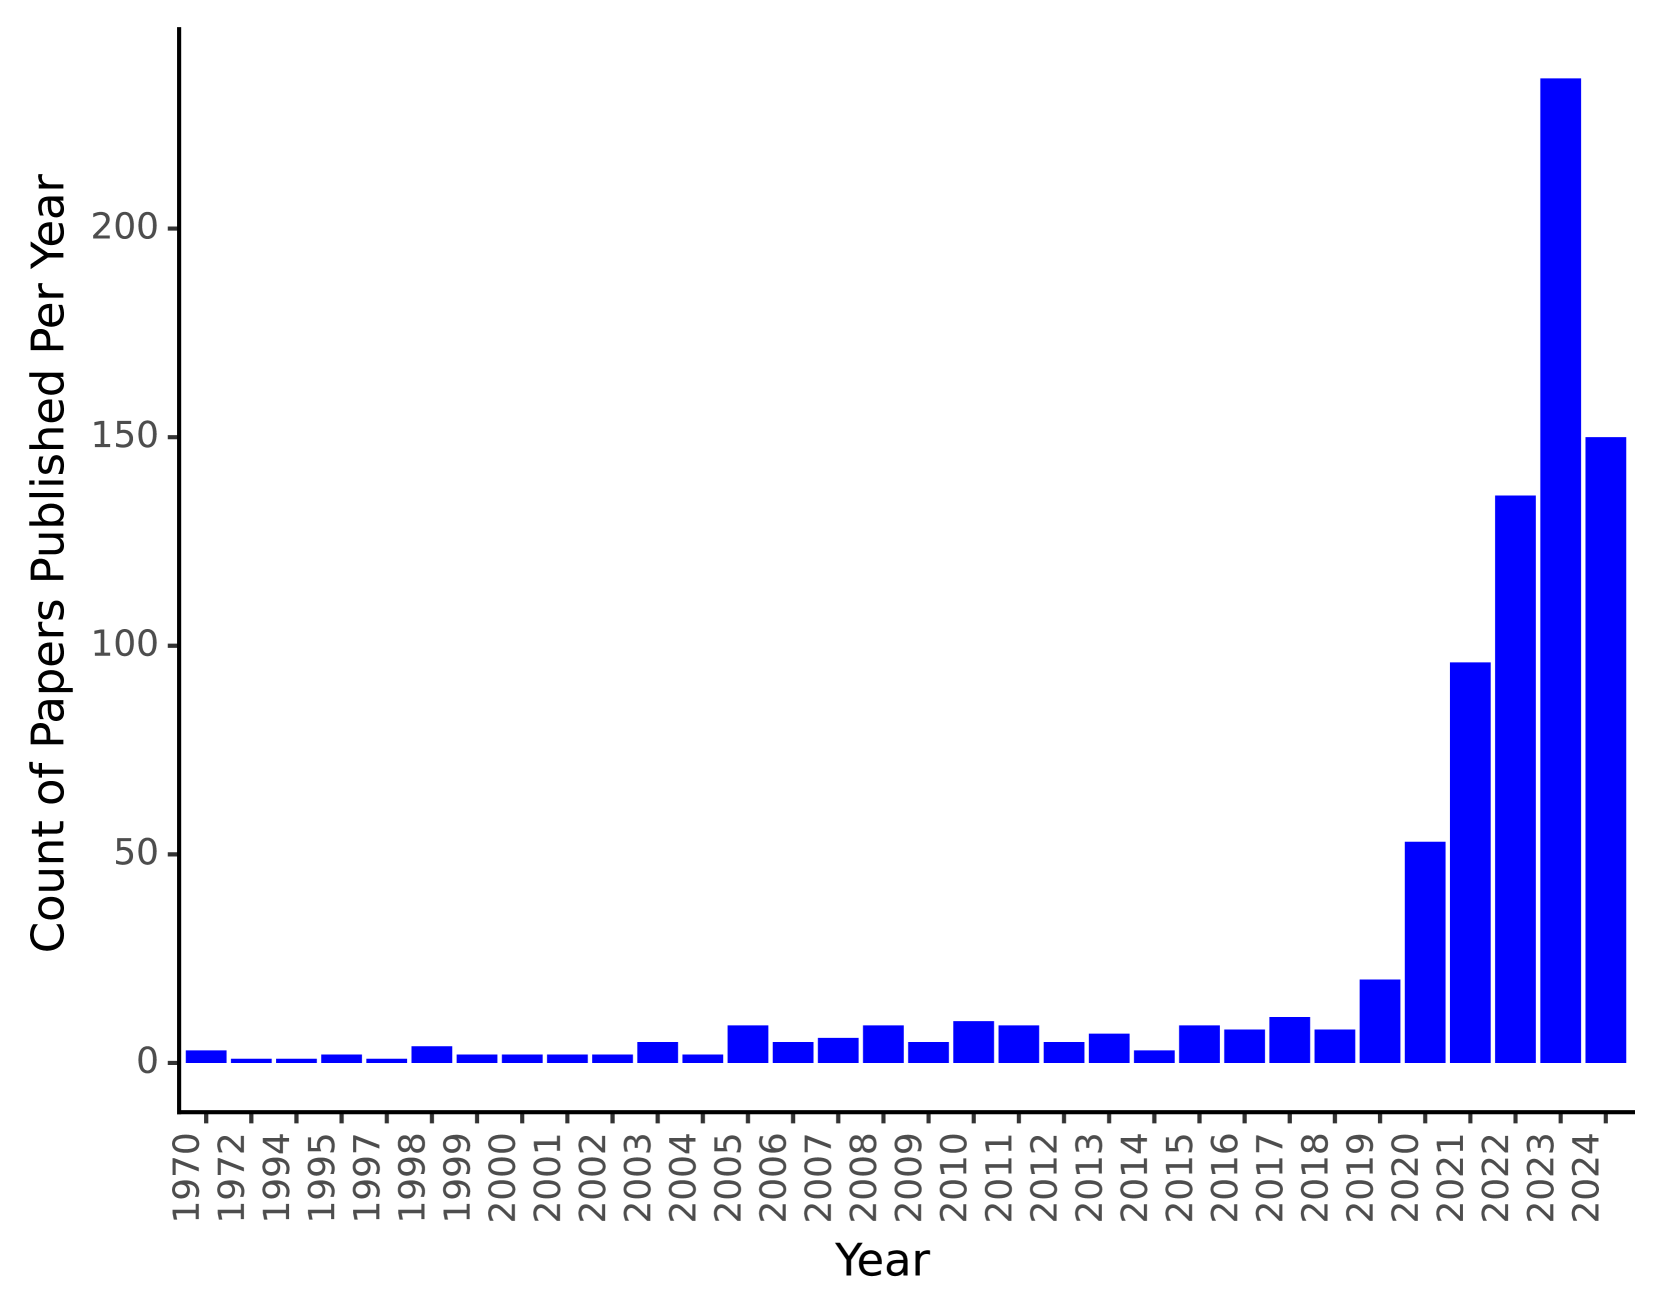
The image is a bar chart showing the count of papers published per year from 1970 to 2024. The y-axis represents the count of papers, and the x-axis represents the year. The bars are blue, and there is a clear upward trend in the number of papers published, especially in recent years.
### Components/Axes
* **X-axis:** Year, ranging from 1970 to 2024. Specific years labeled are: 1970, 1972, 1994, 1995, 1997, 1998, 1999, 2000, 2001, 2002, 2003, 2004, 2005, 2006, 2007, 2008, 2009, 2010, 2011, 2012, 2013, 2014, 2015, 2016, 2017, 2018, 2019, 2020, 2021, 2022, 2023, 2024.
* **Y-axis:** Count of Papers Published Per Year, ranging from 0 to 200. Axis markers are at 0, 50, 100, 150, and 200.
* **Data:** Blue bars representing the number of papers published each year.
### Detailed Analysis
* **1970-2017:** The number of papers published per year is relatively low, generally below 10.
* **2018:** The number of papers published is still low, approximately 5.
* **2019:** The number of papers published starts to increase, around 10.
* **2020:** The number of papers published increases significantly to approximately 20.
* **2021:** The number of papers published increases to approximately 55.
* **2022:** The number of papers published increases to approximately 90.
* **2023:** The number of papers published increases to approximately 135.
* **2024:** The number of papers published increases dramatically to approximately 225.
### Key Observations
* There is a significant increase in the number of papers published in recent years, particularly from 2019 onwards.
* The year 2024 shows the highest number of papers published by a large margin.
* The period from 1970 to 2017 shows a relatively stable and low number of publications.
### Interpretation
The bar chart indicates a substantial growth in the number of published papers over time, with a particularly sharp increase in recent years. This could be due to various factors such as increased research funding, advancements in technology facilitating research and publication, or a growing interest in the specific field of study. The dramatic increase in 2024 suggests a potential breakthrough or a significant shift in the research landscape. The relatively low publication rates before 2018 could indicate a slower pace of research or a smaller community of researchers in the field during those years.