\n
## Bar Chart: Count of Papers Published Per Year
### Overview
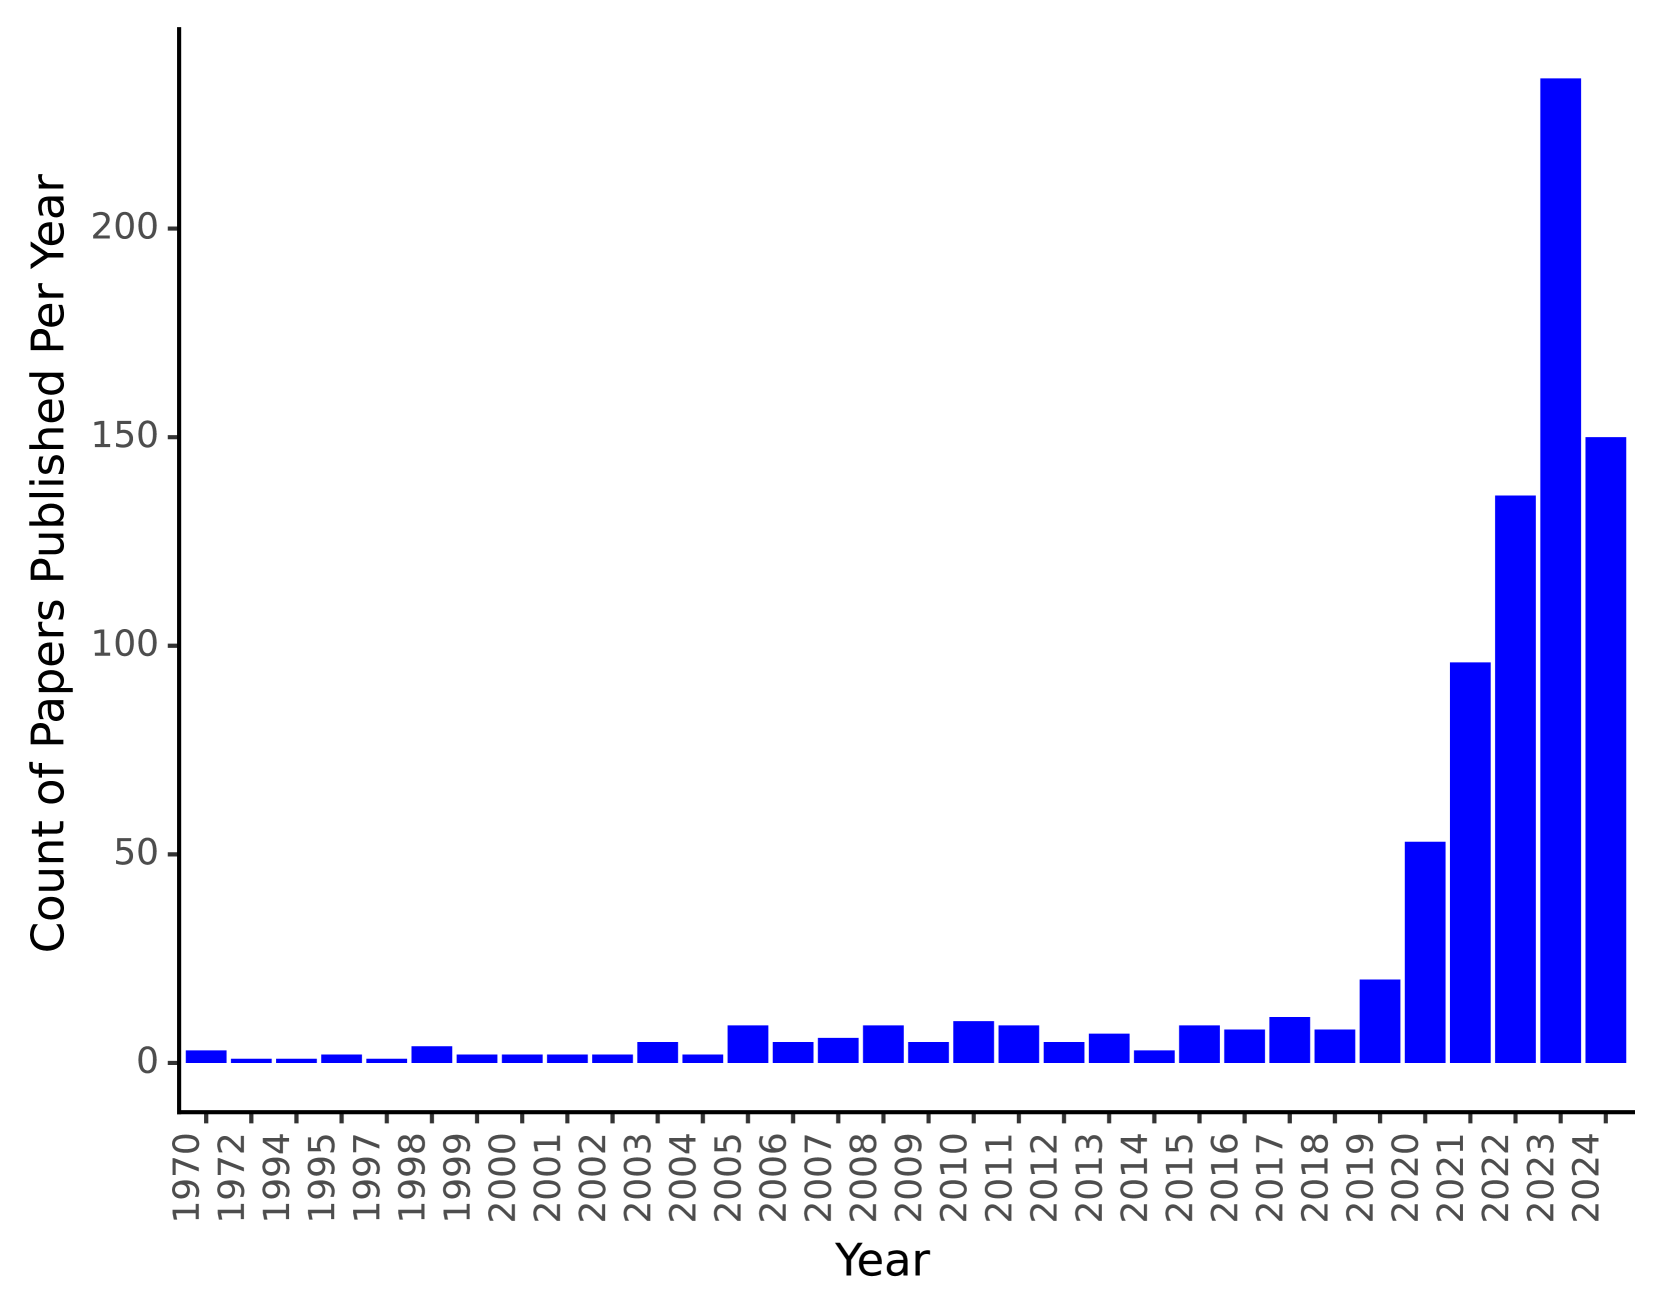
The image presents a bar chart illustrating the number of papers published per year from 1970 to 2024. The chart shows a generally flat trend from 1970 to 2019, followed by a steep increase in the number of publications from 2020 onwards.
### Components/Axes
* **X-axis:** Year, ranging from 1970 to 2024. The years are labeled at approximately yearly intervals.
* **Y-axis:** Count of Papers Published Per Year, ranging from 0 to 200+, with increments of approximately 50.
* **Bars:** Represent the count of papers published in each year. The bars are a uniform dark blue color.
* **No Legend:** There is no legend present in the image.
### Detailed Analysis
The chart displays the following approximate data points:
* **1970-1994:** The number of papers published each year remains consistently low, fluctuating around 2-5 papers per year.
* **1995-2002:** A slight increase is observed, with the count ranging from approximately 5 to 10 papers per year.
* **2003-2017:** The count remains relatively stable, fluctuating between approximately 10 and 20 papers per year.
* **2018:** The count increases to approximately 25 papers.
* **2019:** The count increases to approximately 30 papers.
* **2020:** A significant jump is observed, with the count rising to approximately 50 papers.
* **2021:** The count increases further to approximately 90 papers.
* **2022:** The count increases dramatically to approximately 135 papers.
* **2023:** The count reaches a peak of approximately 215 papers.
* **2024:** The count is approximately 150 papers.
The trend from 1970 to 2019 is nearly flat, indicating a stable publication rate. From 2020 onwards, the trend is sharply upward, indicating a rapid increase in the number of papers published.
### Key Observations
* The most significant observation is the exponential growth in the number of papers published starting in 2020.
* The publication rate remained remarkably consistent for nearly five decades (1970-2019).
* The 2023 peak is substantially higher than any previous year's publication count.
* The 2024 count is lower than 2023, but still significantly higher than any year prior to 2020.
### Interpretation
The data suggests a major shift in research activity or publication trends beginning around 2020. This could be due to several factors, such as increased funding for research, the emergence of new research areas, or changes in publication practices. The consistent low publication rate from 1970 to 2019 suggests a period of relative stability in the field represented by this data. The sharp increase in 2020 and subsequent years indicates a period of rapid growth and innovation. The slight decrease in 2024 compared to 2023 could indicate a temporary slowdown or a stabilization of the growth trend. Further investigation would be needed to determine the underlying causes of these trends.